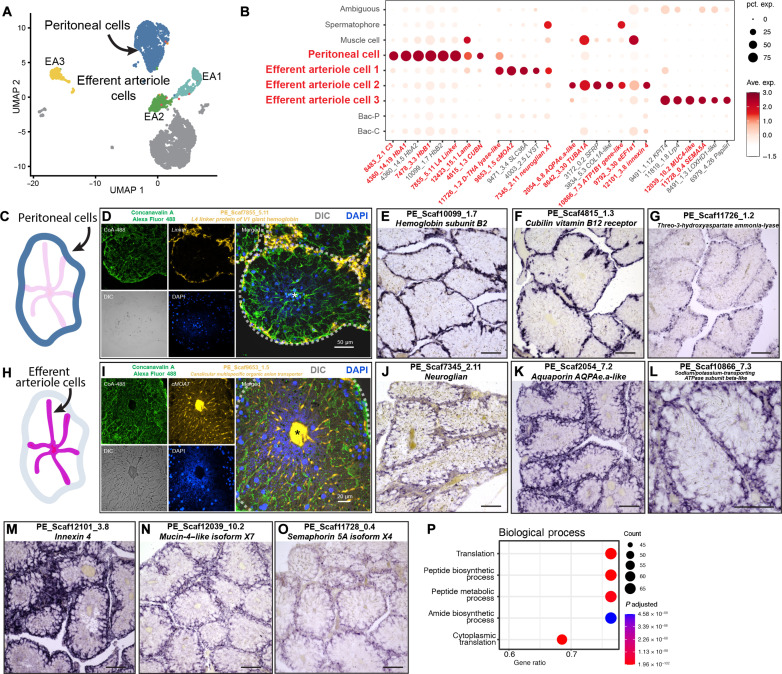
Fig. 3. Characterization of peritoneal cells and EA cells of P. echinospica trophosome.
(A) UMAP representation of peritoneal cell cluster and EA cell clusters. (B) Expression profiles of the cell markers that are specific or enriched in the peritoneal cell and EA cell populations. The sizes of the circles represent the percentages of cells in those clusters that expressed a specific gene. Genes shown in red were examined by ISHs. (C to G) FISH and colorimetric ISH of peritoneal cell population markers. DIC, differential interference contrast. (H to O) Colorimetric ISH of EA cell population markers. (P) Enriched GO biological process terms in the EA3 cell populations. The scale bars in the colorimetric ISH analyses represent 100 μm.

