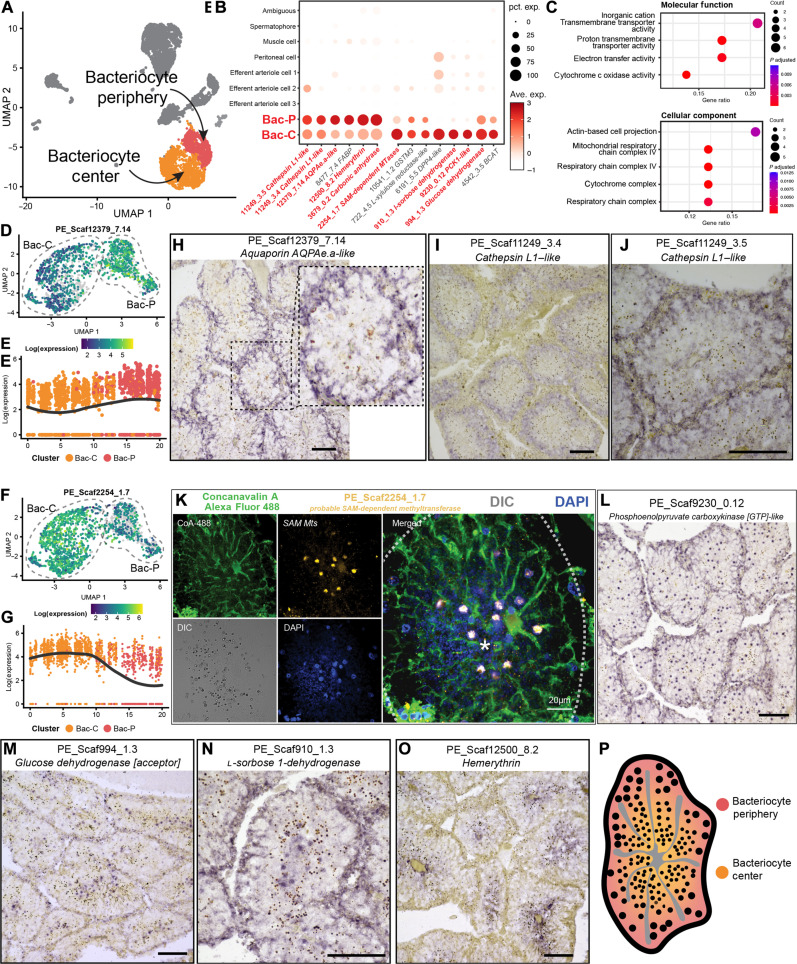
Fig. 4. Characterization of bacteriocyte cells of P. echinospica trophosome.
(A) UMAP representation of the two bacteriocyte populations: the Bac-P and the Bac-C. (B) Expression profiles of the cell markers that are specific or enriched in two bacteriocyte populations. The sizes of the circles represent the percentages of cells in those populations that expressed a specific gene. Genes shown in red were examined by ISH. (C) Enriched GO molecular function and cellular component terms in the Bac-C populations. (D and E) Gene expression trajectory analysis of Bac-P marker aquaporin AQPAe.a-like (PE_Scaf12379_7.14), showing a gradient pattern of transitioning from higher Bac-P to lower Bac-C cells. (F and G) Gene expression trajectory analysis of Bac-C marker probable SAM Mt (PE_Scaf2254_1.7), showing a gradient pattern of transitioning from higher Bac-C to lower Bac-P cells. (H to J) Colorimetric ISH analyses of Bac-P population markers, showing the genes encoding AQPAe.a-like (PE_Scaf12379_7.14), cathepsin L1–like (PE_Scaf11249_3.4), and cathepsin L1–like (PE_Scaf11249_3.5) are all highly expressed in the Bac-P cells. (K) FISH analysis of Bac-C gene marker probable SAM Mt (PE_Scaf2254_1.7), showing that the gene is expressed in the nucleus of Bac-C cells. The semitransparent dashed line marks the outline of the trophosome lobule, and the asterisk indicates the center of the lobule. (L to N) Colorimetric ISH analyses of Bac-C markers, showing that the genes encoding phosphoenolpyruvate carboxykinase [GTP]-like (PE_Scaf9230_0.12), glucose dehydrogenase [acceptor] (PE_Scaf994_1.3), and l-sorbose 1-dehydrogenase (PE_Scaf910_1.3) are highly expressed in the Bac-C cells. (O) Colorimetric ISH analysis of the gene encoding hemerythrin (PE_Scaf12500_8.2), showing that the gene is highly expressed in the Bac-C cells. (P) Diagram showing the proposed spatial distribution of two bacteriocyte populations in a single trophosome lobule. The scale bars in the colorimetric ISH analyses represent 100 μm.

