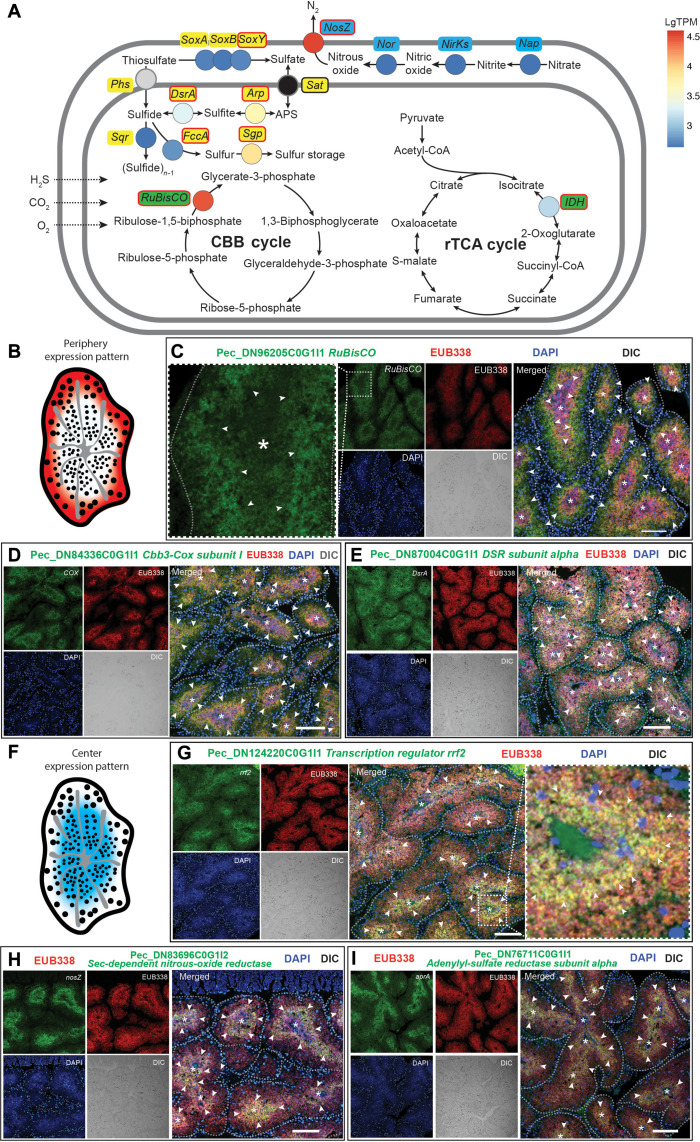
Fig. 5. FISH analysis of metabolic states of the bacteriocytes in P. echinospica.
(A) Diagram showing the major metabolic pathways in the bacteriocytes. The color of each gene represents the expression level [lgTPM expression level based on (27)]. The genes labeled in red circles have been analyzed by FISH. (B) Diagram demonstrating the genes expressed in the periphery of a trophosome lobule. (C to E) Double FISH analyses of the key metabolic genes expressed in the symbionts located in the periphery of a trophosome lobule, including the genes encoding RuBisCO (Pec_DN96205C0G1I1), Cbb3-type cytochrome c oxidase subunit (Cbb3-Cox; Pec_DN84336C0G1I1), and Dsr alpha subunit (dsrA; Pec_DN96205C0G1I1). (F) Diagram demonstrating the genes expressed in the bacteriocytes in the center of a trophosome lobule. (G to I) Double FISH analyses of the key metabolic genes expressed in the symbionts in the center of a lobule, including the genes encoding transcription regulator rrf2 (rrf2; Pec_DN124220C0G1I1), sec-dependent NosZ (Pec_DN83696C0G1I2), and AprA (Pec_DN76711C0G1I1). The semitransparent dashed line marks the outline of each trophosome lobule, and the asterisk indicates the center of the lobules. The white arrowheads highlight regions exhibiting elevated expression of symbiont genes. The scale bars represent 100 μm.

