


Fig. 2.
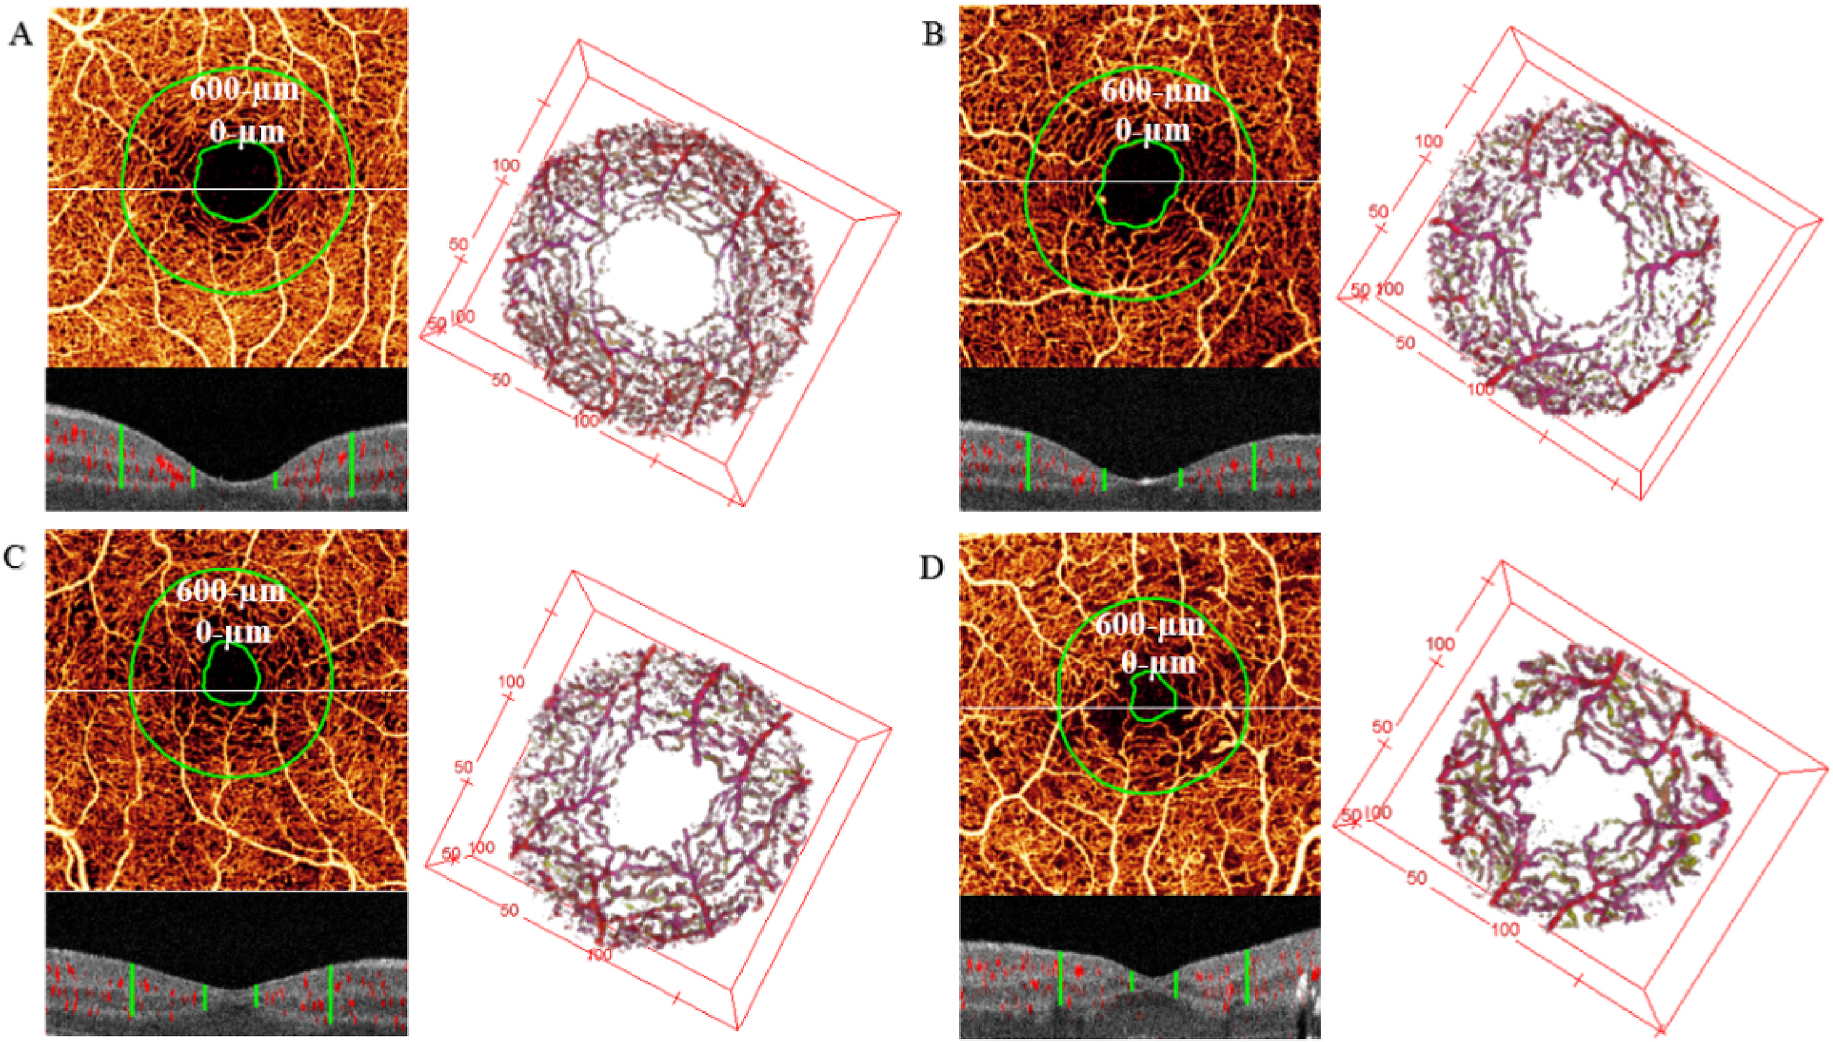
Three-dimensional para-FAZ vessel density in the eyes of a healthy control (A), with diabetes without retinopathy (B), with mild-to-moderate non-proliferative diabetic retinopathy (C), and with proliferative diabetic retinopathy (D). Upper left panels of (A–D): en face maximum projection of inner-retinal angiogram. The inner green line represents the tbFAZ boundary; the outer green line represents 600 μm distances from the tbFAZ boundary in the transverse direction. The white horizontal line indicates the position of the representative B-scan in the panel below. Lower left panels of (A–D): cross-sectional B-scan overlaid with angiographic signal (red). The green vertical lines indicate the analytic para-FAZ volume boundary locations in the inner retina. Right panels of (A–D): corresponding volumetric para-FAZ optical coherence tomography angiography. FAZ, foveal avascular area; tbFAZ, theoretical baseline FAZ. Reproduced with permission from Wang, B. et al., 2019. Biomed Opt Express 10, 3522.