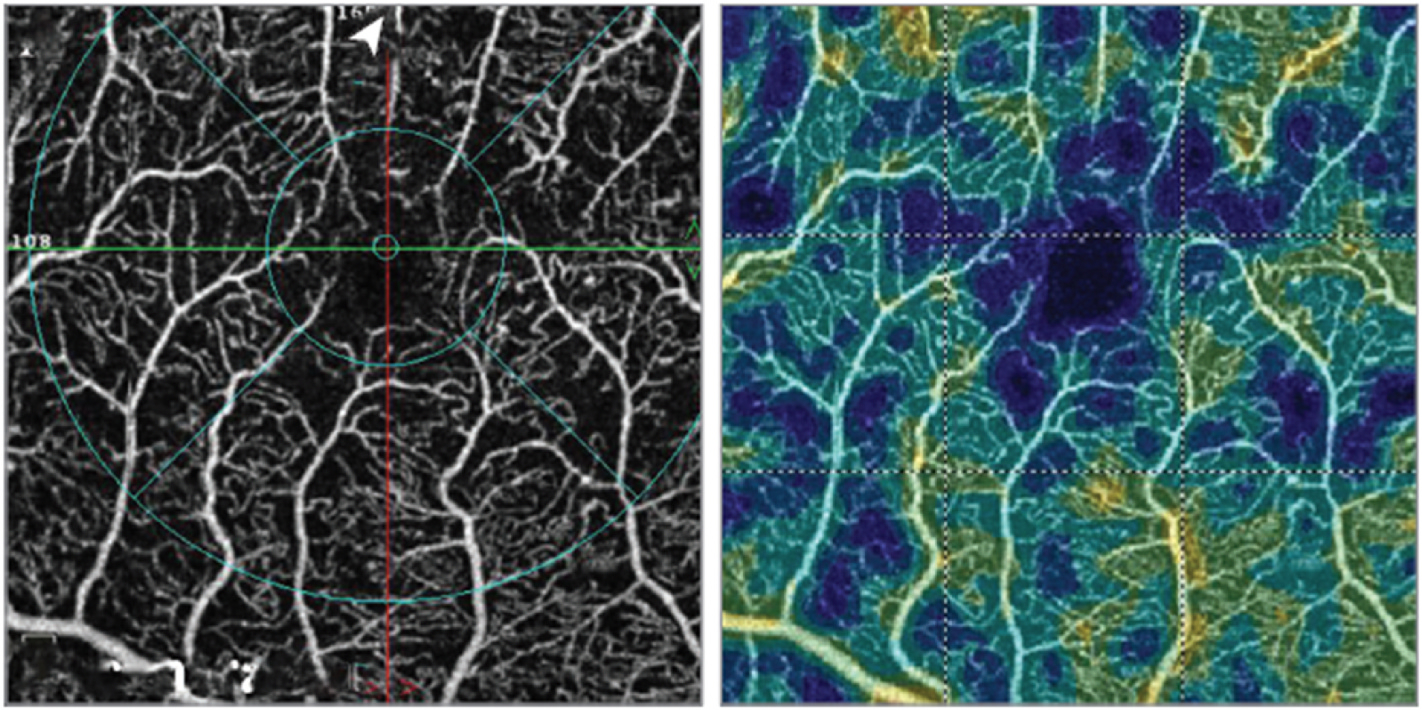
Fig. 9.

Example of a scan decentration artifact: optical coherence tomography angiography image (left) and vascular density map (right). Superior shift of the fovea when centering the scan results in the loss of the inner subfield (indicated by the white arrowhead). Adapted from Hormel, Teo et al., 2021. Quant Imaging Med Surg 11(3), 1120–1133.
