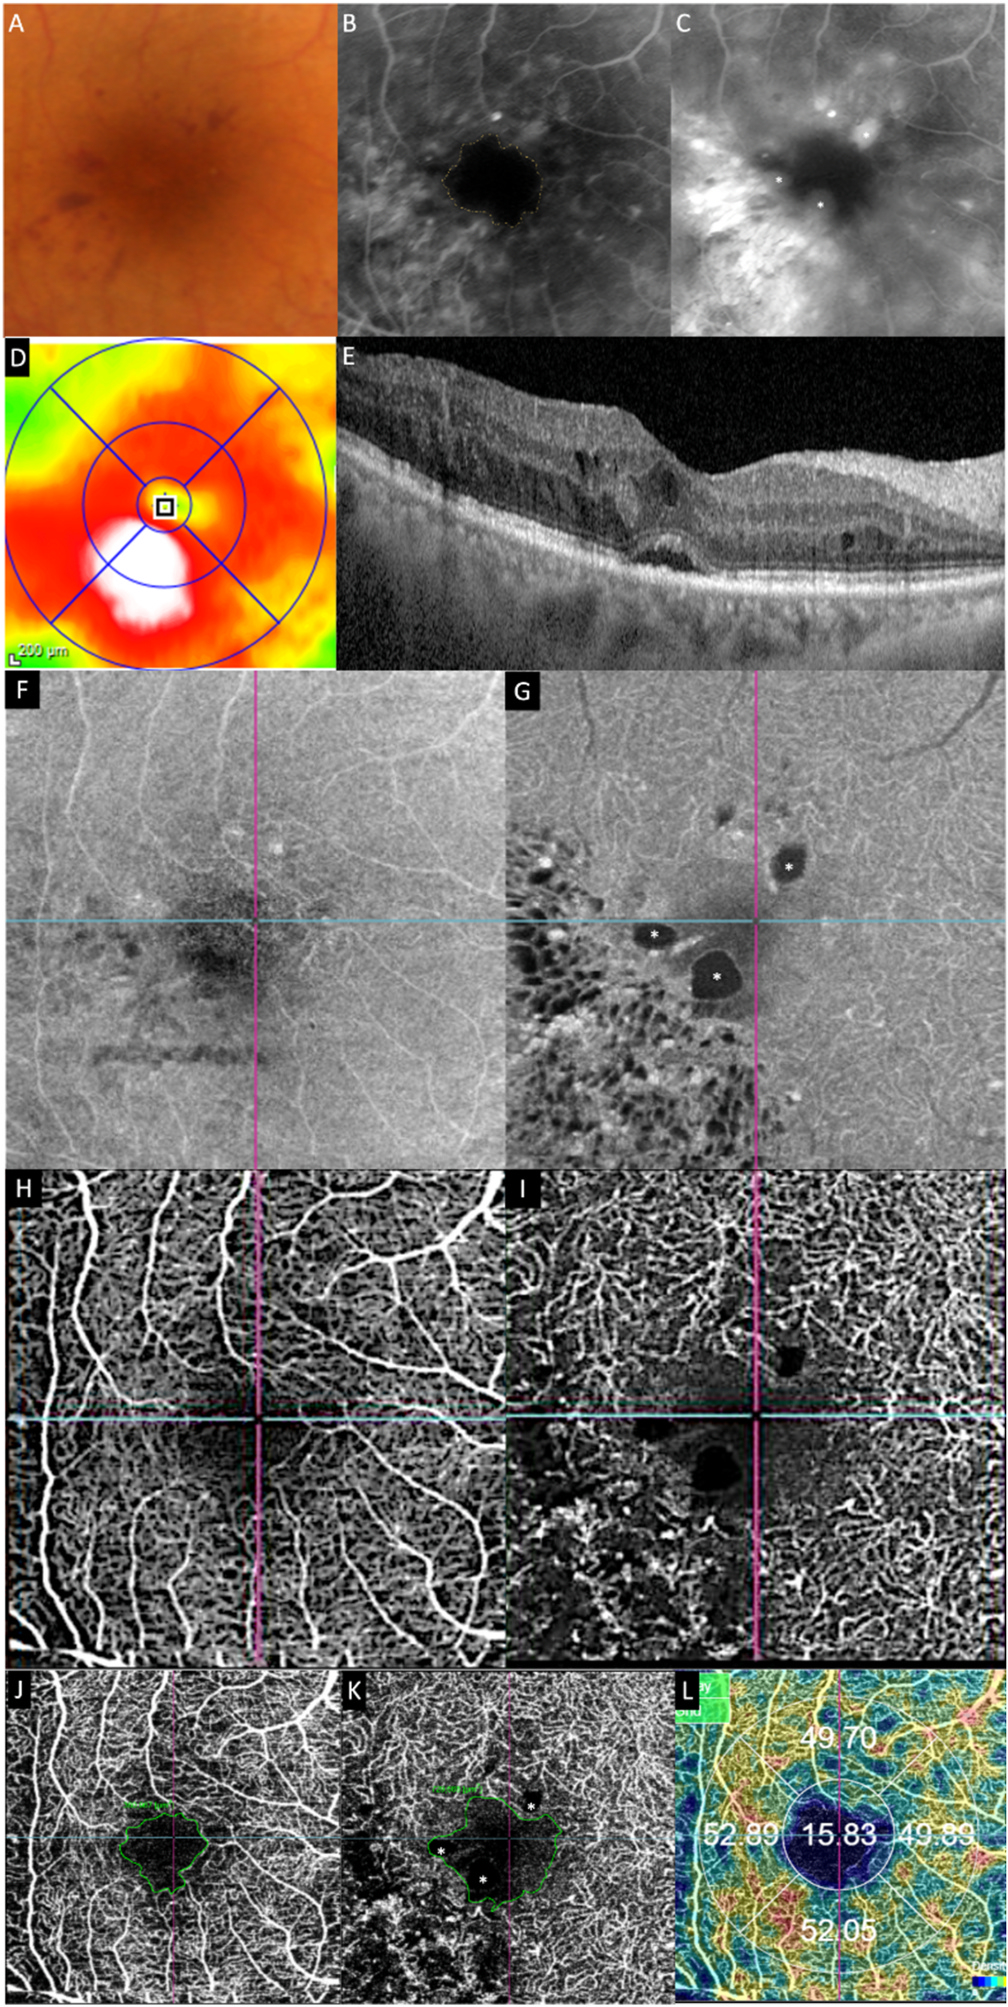
Fig. 3.

Multimodal imaging of an eye with diabetic maculopathy and diabetic macula ischaemia. (A) The colour fundus photograph illustrates the presence of dot and blot haemorrhages in the macula. (B) In the early phase of fluorescein angiography, microaneurysms can be seen. The foveal avascular zone is acircular and enlarged (dotted yellow line). (C) In the late phase of fluorescein angiography, diffuse leakage suggests the presence of macular oedema. Large cysts are detected as areas of well-circumscribed, circular areas of hyperfluorescence (*). These cysts are also represented by the * symbol in the optical coherence tomography (OCT) structural (G) and OCT angiography scans (K). (D) The Distribution of oedema can be appreciated in en face OCT retinal thickness map and the corresponding cross-sectional OCT scan (E). (E) showed the presence of intraretinal cysts and subretinal fluid, further confirming the presence of macular oedema. The central subfield thickness is 403 μm. F to L are images from Triton/Topcon platform. (F and G) are the structural enface OCT scans of the superficial capillary plexus (SCP) and the deep capillary plexus (DCP). Retinal cysts are much better appreciated on the structural scan of the DCP (G), with the three corresponding cysts on the other scans denoted by (*). H to L are images from OCT angiography (OCTA) covering a 3 × 3 mm area centred over the fovea. H and I are unannotated OCTA scans of the SCP and the DCP, respectively. (H) The FAZ outline is acircular and enlarged, with reduced perfusion in the perifoveal area. (I) In the corresponding deep plexus OCT angiography, the FAZ area appears larger than that in the superficial plexus. The capillary bed appears disrupted in the area inferotemporal to the fovea centre. J (SCP) and K (DCP) are the same OCTA images in H and L, with annotated areas of FAZ outlined manually in green and areas calculated automatically. The intraretinal cysts are marked by (*). (L) The automated perfusion density scan shows the proportion of perfused (areas with the flow) versus the total area of interest. This automated perfusion density measure is an inbuilt algorithm within the Imagenet (Topcon) software.
