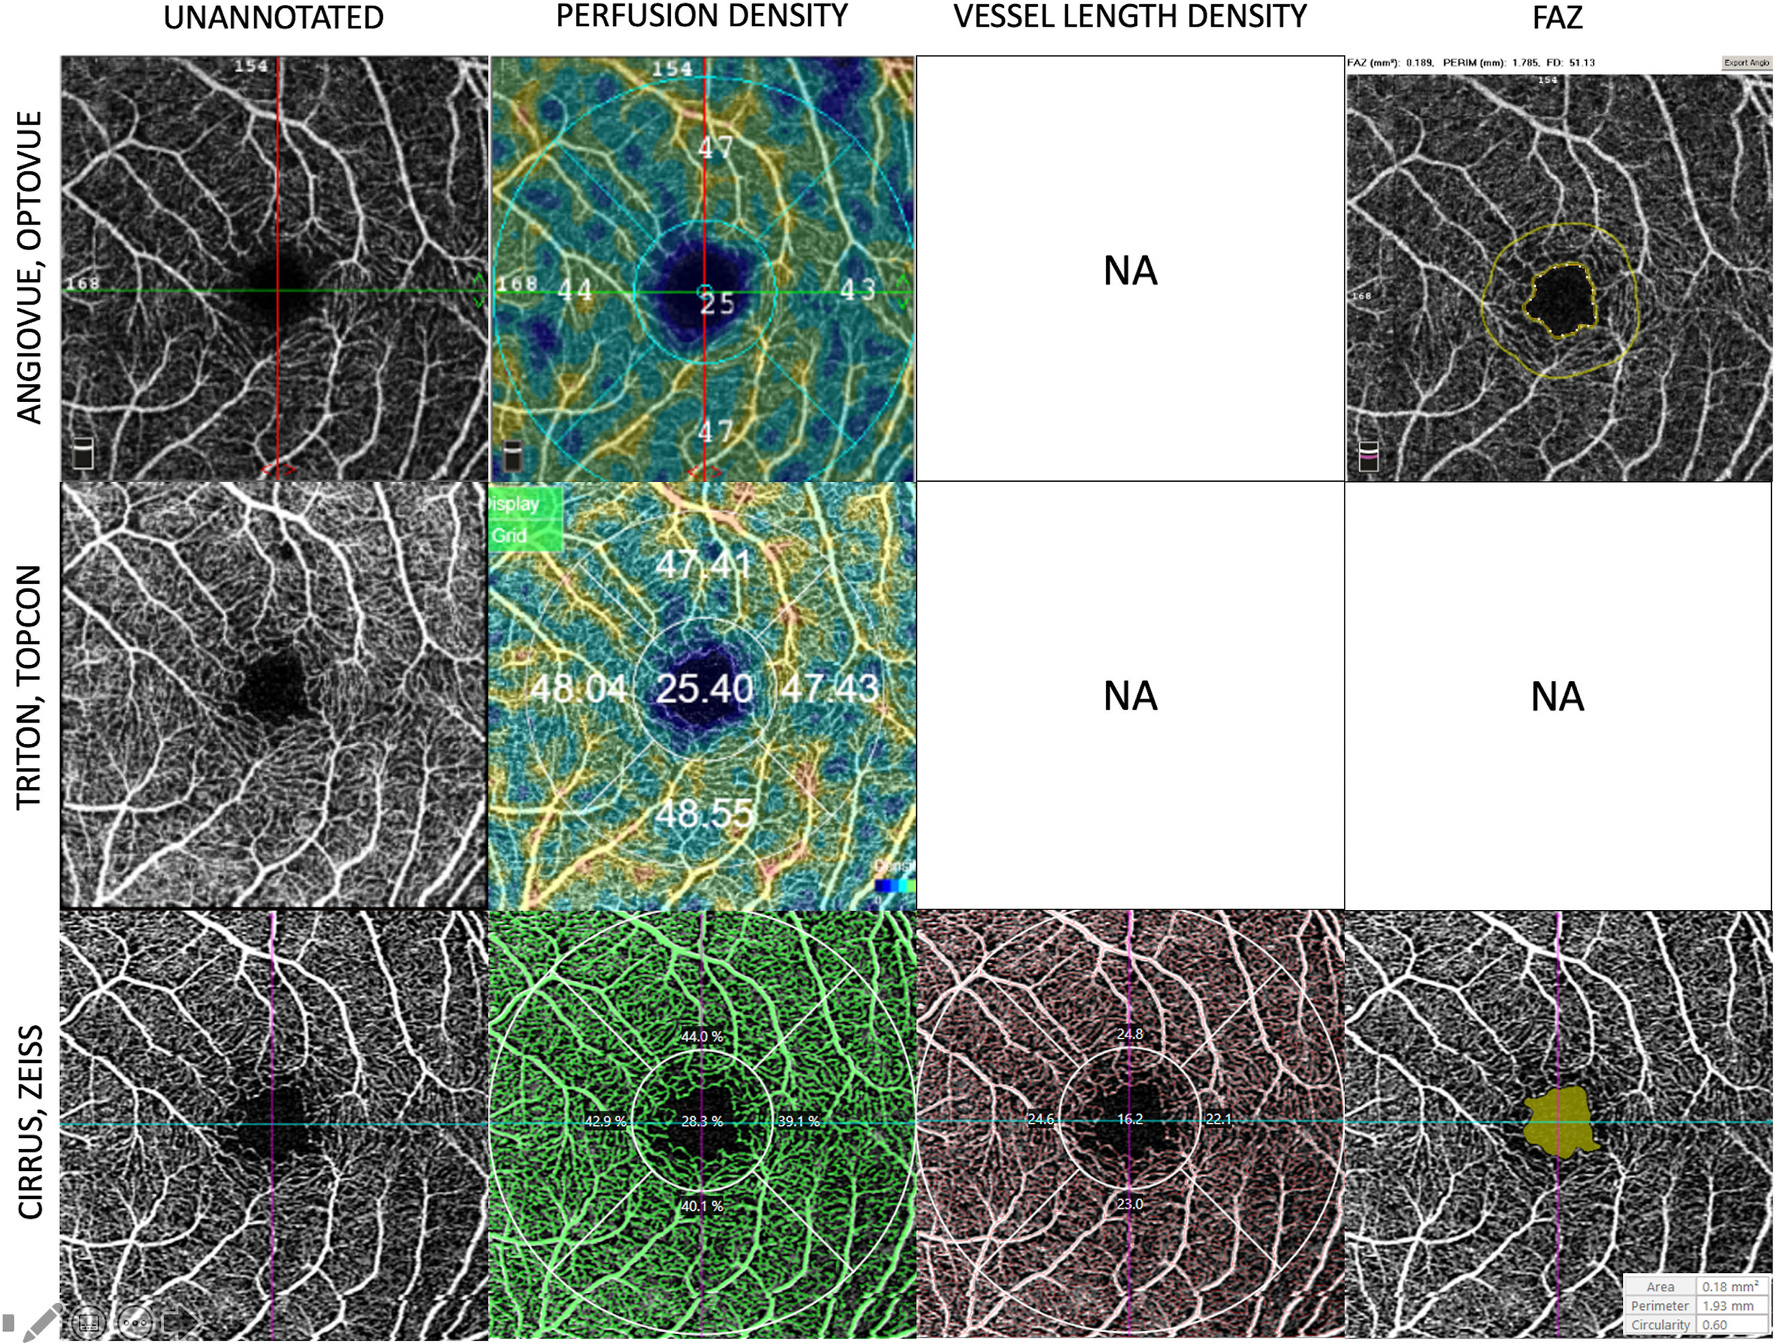
Fig. 4.

Examples of the quantification of perfusion density, vessel length density, and foveal avascular zone (FAZ) generated by the in-built algorithms available on the commercial OCTA instruments. This figure shows the automated readouts and presentation modes on the three commercially available OCTA platforms. The first column shows the unannotated OCTA images of the superficial plexus of a normal eye. The second column shows the perfusion density (expressed as a percentage of white pixels over the region of interest). The third column shows the vessel length density currently only available on the Cirrus (Zeiss platform). The last column shows the detection and quantification of the foveal avascular zone available on the Angiovue/Optovue and Cirrus/Zeiss. OCTA = optical coherence tomography angiography.
