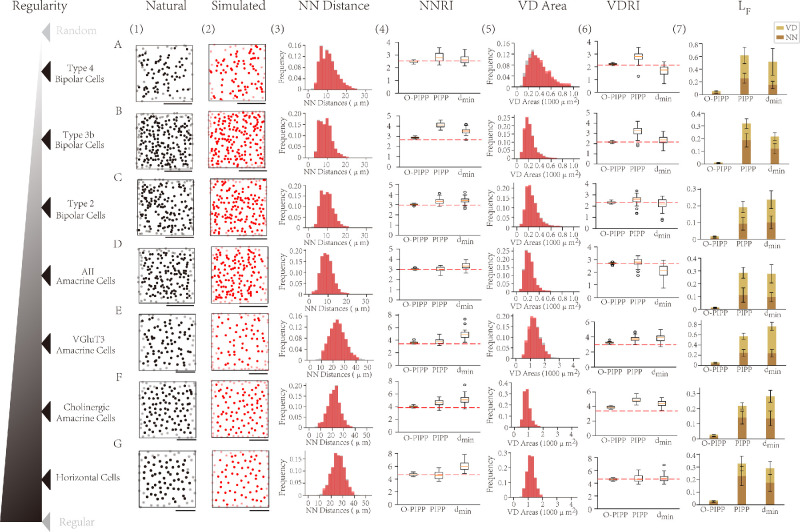
Figure 2.
Simulation results with the O-PIPP approach on WT retinal mosaics. (A–G) Cell types are ordered by the regularity index (NNRI) of the natural mosaic. Scale bars: 100 µm. (1) The natural mosaics adapted from Reference 4. (2) The artificial mosaics generated by the O-PIPP approach. (3) The distributions of NN distances in natural mosaics (gray), overlaid by values extracted from O-PIPP–simulated mosaics (transparent red). (4) Boxplots of NNRIs of the single mosaic simulated by the O-PIPP approach, the PIPP model, and the dmin model. (5) The distributions of VD areas in natural mosaics (gray), overlaid by values extracted from O-PIPP-generated mosaics (transparent red). (6) Boxplots of the VDRIs of the single mosaics simulated by the O-PIPP approach, the PIPP model, and the dmin model. (7) The loss of simulated mosaics.

