
Figure 3:
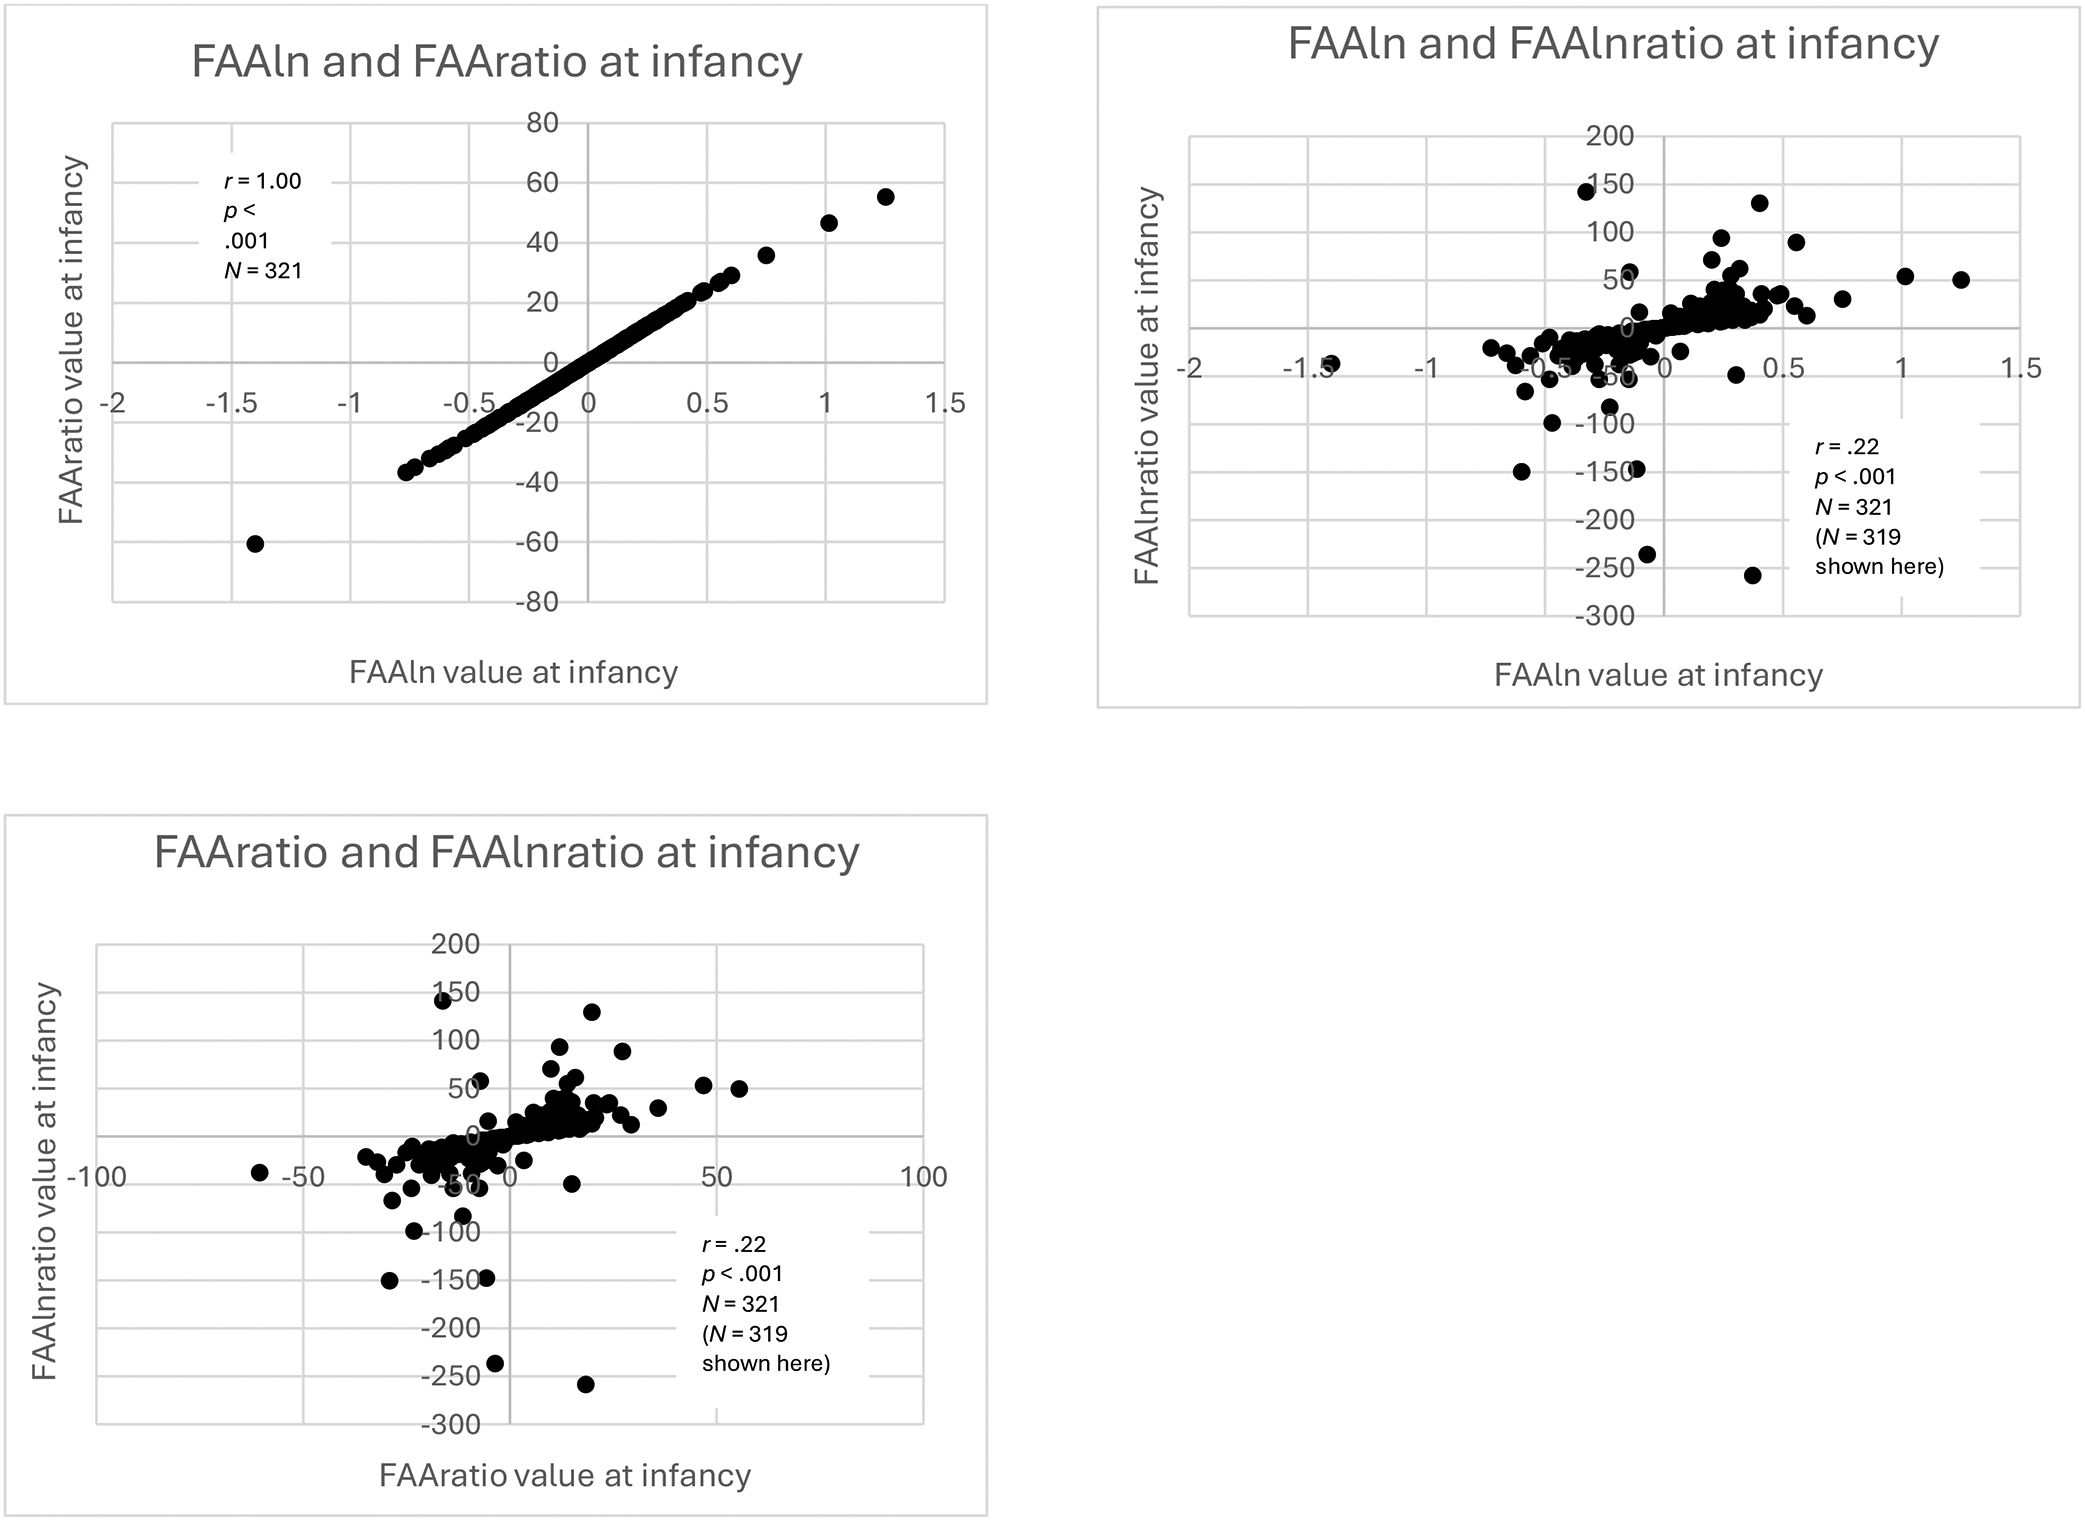
Scatterplots of infancy within-time correlations of FAAln, FAAratio, and FAAlnratio
Scatterplots of within-time correlations of FAAln, FAAratio, and FAAlnratio values at infancy. For the purpose of visualization, the most extreme outliers on either end of the distribution of FAAlnratio values were omitted from the original sample of N = 321, but correlation analysis was performed on the full sample.