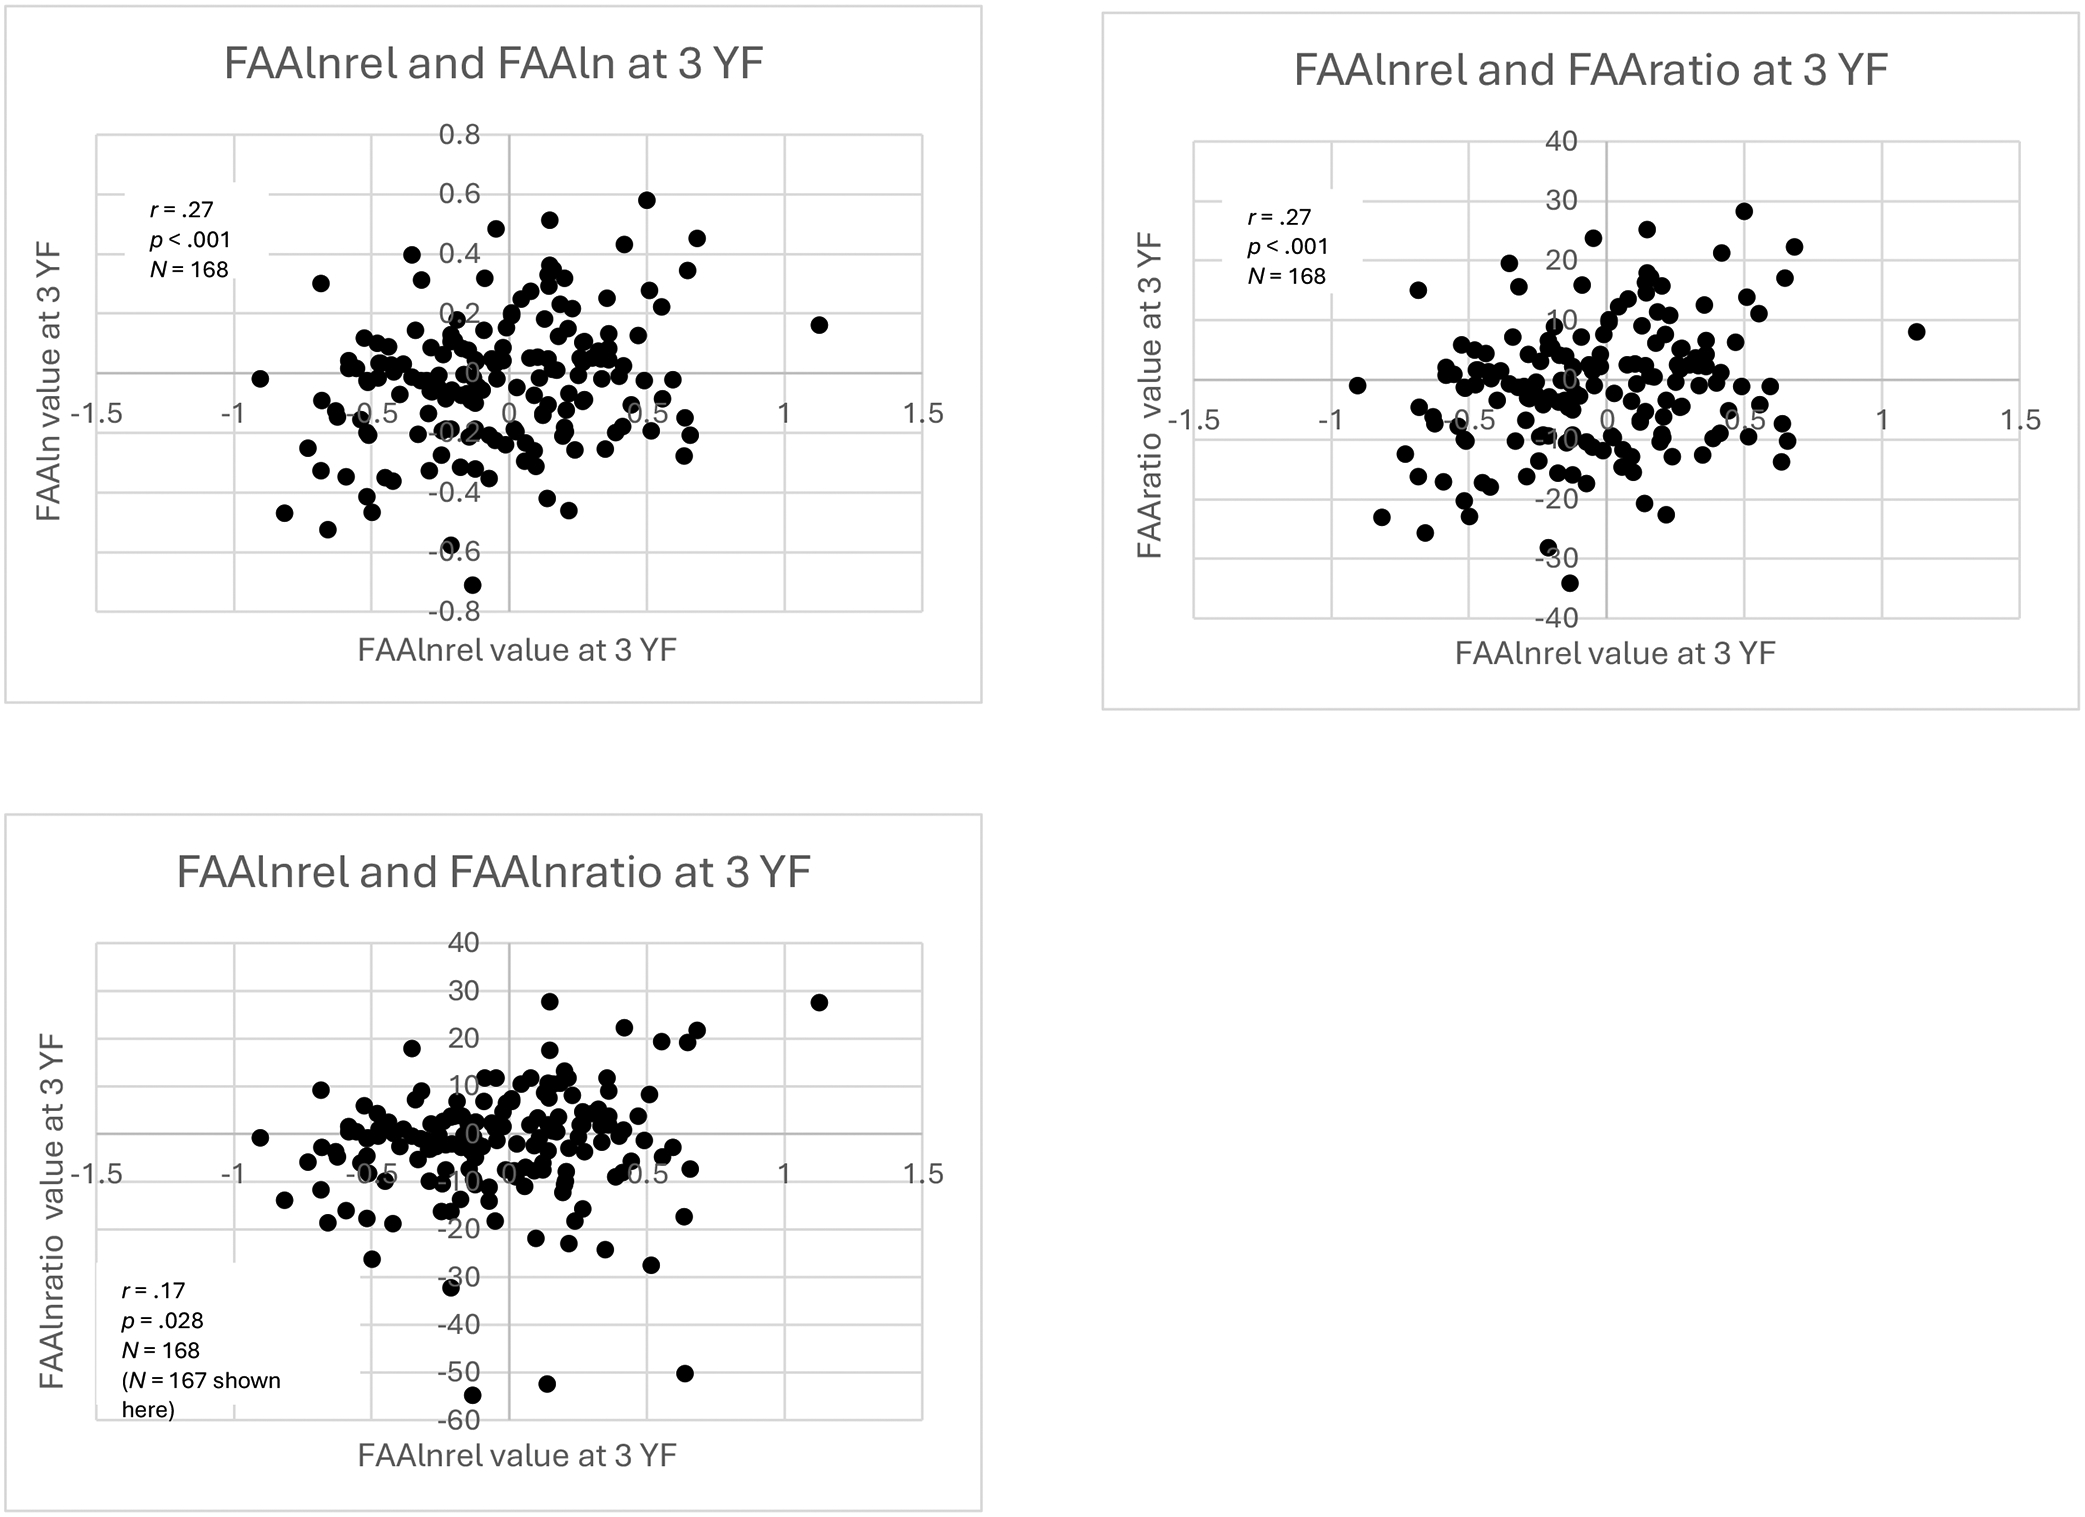
Figure 6:

Scatterplots of three-year (3 YF) within-time
Scatterplots of within-time correlations of FAAlnrel values at 3 YF with values from other equations. For the purpose of visualization, the most extreme maximum outlier on the distribution of FAAlnratio values was omitted from the original sample of N = 168, but correlation analysis was performed on the full sample.
