. 2024 Jun 6;15(29):11540–11549. doi: 10.1039/d4sc00971a

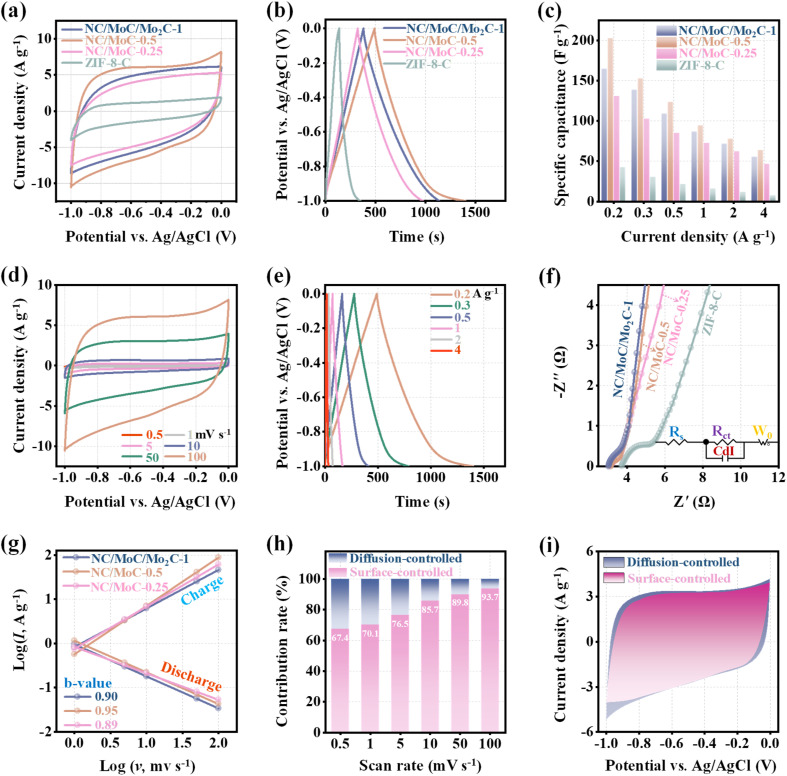
Fig. 3. (a) CV curves at 100 mV s−1, (b) GCD curves at 0.2 A g−1, and (c) the specific capacitance values at different current densities for NC/MoC-0.25, NC/MoC-0.5, NC/MoC/Mo2C-1, and ZIF-8-C. (d) CV curves of NC/MoC-0.5 at the scan rates from 0.5 to 100 mV s−1. (e) GCD curves of NC/MoC-0.5 at current densities from 0.2 to 4 A g−1. (f) Nyquist plots of the three NC/MoyC-x and ZIF-8-C. Inset: the equivalent circuit diagram of NC/MoC-0.5. (g) The fitted curves between current densities and the scan rates in charge and discharge processes for NC/MoC-0.25, NC/MoC-0.5 and NC/MoC/Mo2C-1. (h) Normalized proportions of surface- and diffusion-controlled contributions at different scan rates for NC/MoC-0.5. (i) Decoupling of surface- and diffusion-controlled contributions for NC/MoC-0.5 at a scan rate of 50 mV s−1.

Fig. 3