. 2024 Apr 30;15(29):11272–11278. doi: 10.1039/d4sc00851k

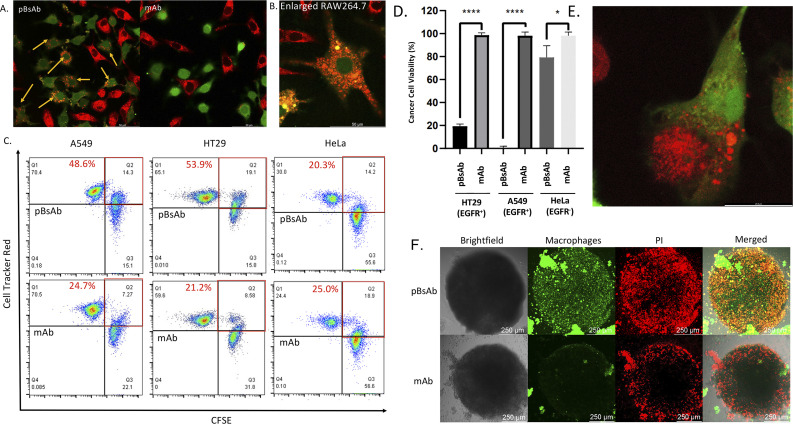
Fig. 7. (A) Confocal microscopic images of the co-cultured RAW264.7 macrophages (green) and A549 cells (red) treated with the pBsAb or anti-SIRP-α mAb (20 nM) for 24 h. The yellow arrow shows the phagocytic macrophages. (B) Enlarged confocal microscopic image of the phagocytic macrophages (green) treated with the pBsAb (20 nM) for 24 h. (C) Flow cytometric quadrant analysis of the co-cultured RAW264.7 macrophages (green) and A549, HT29, and HeLa cells (red) treated with the pBsAb (20 nM) or anti-SIRP-α mAb (20 nM) for 2 h. The red squares show the percentage of phagocytotic macrophages under different conditions. (D) Cancer cell viability assay of RAW264.7 macrophages against EGFR-overexpressed (A549 and HT29) and EGFR-negative cells (HeLa) upon treatment with 50 nM of pBsAb and anti-SIRP-α mAb. Data are expressed as the mean value ± SEM of three independent experiments. ****P < 0.0001 compared to the corresponding control of mAb, * no significant difference. (E) Confocal image of the phagocytosis process. The macrophage (green) was engulfing the HT29 (red) in the presence of the pBsAb. (F) Confocal Z-stack maximum projection microscopic images of HT29 cancer cell spheroids co-cultured with RAW264.7 macrophages (green) upon treatment with the pBsAb or anti-SIRP-α mAb (50 nM) for 24 h. The dead cells were stained with PI (red).

Fig. 7