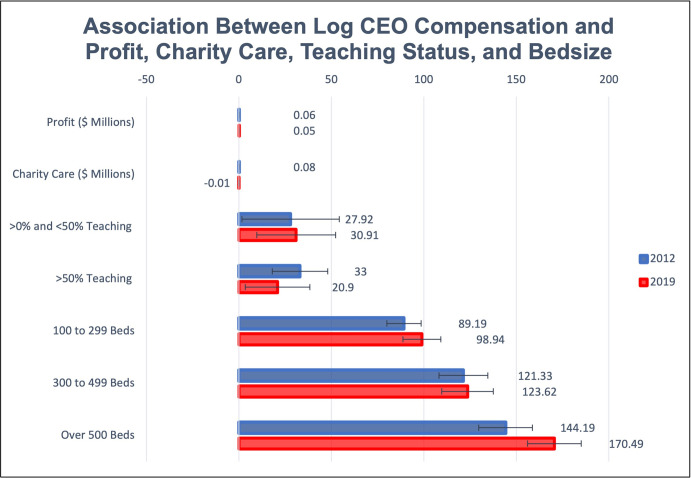
Fig 2. Association between CEO compensation and profit, charity care, teaching status and Bedsize.
Fig 2 presents the results of our regression analyses for 2012 and 2019 where we regress profit, charity care, and categorical measures of teaching status and bed size on log CEO compensation. CEO compensation, profit (in $millions), and charity care (in $millions) are defined using 2019 dollars. Teaching status is defined as the percentage of adjusted discharges that occurred at a teaching hospital within the system or hospital. We multiply the regression coefficients by 100 to approximate the associated percentage change in CEO compensation. The estimates for profit and charity care can be interpreted as the estimated percentage change in CEO compensation associated with a one million dollar increase in profit or charity care. While the estimates for the bed size and teaching categorical variables should be interpreted as the increase in CEO compensation associated with each category of hospital size or teaching status relative to the reference group (hospitals with less than 100 beds, or hospitals/health systems with no adjusted discharges at teaching hospitals). Confidence intervals are presented at 95 percent confidence levels. The base case log CEO compensation (or the intercept term in our regression analysis, defined as estimated compensation for CEOs at hospitals with zero profits or charity care, less than 100 beds, and no adjusted discharges at teaching hospitals) is 12.56 in 2012 and 12.64 in 2019 which corresponds to 286,338 and 307,807 in 2019 dollars. The difference in base case CEO compensation from 2012 to 2019 is not statistically significant. There are 1,113 hospital or health systems in the 2012 sample and 868 in 2019.

