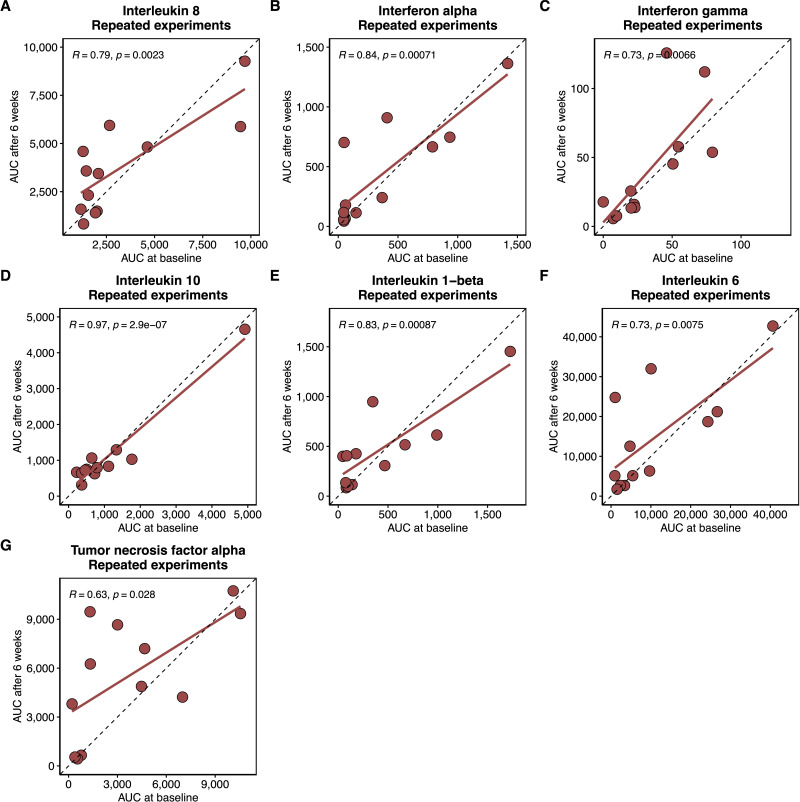
Figure 3.
Dot plots assessing the correlation between the individual cytokine AUCs (pg/mL*h) of the baseline and week 6 ex vivo LPS stimulation. (A) interleukin 8, (B) interferon-α, (C) interferon-γ, (D) interleukin 10, (E) interleukin 1-β, (F) interleukin 6, and (G) TNF-α. The red line is the regression line based on the observed AUCs. Each dot represents one participant. The dashed line indicates a perfect correlation. R is the Pearson correlation coefficient, accompanied by unadjusted p values.

