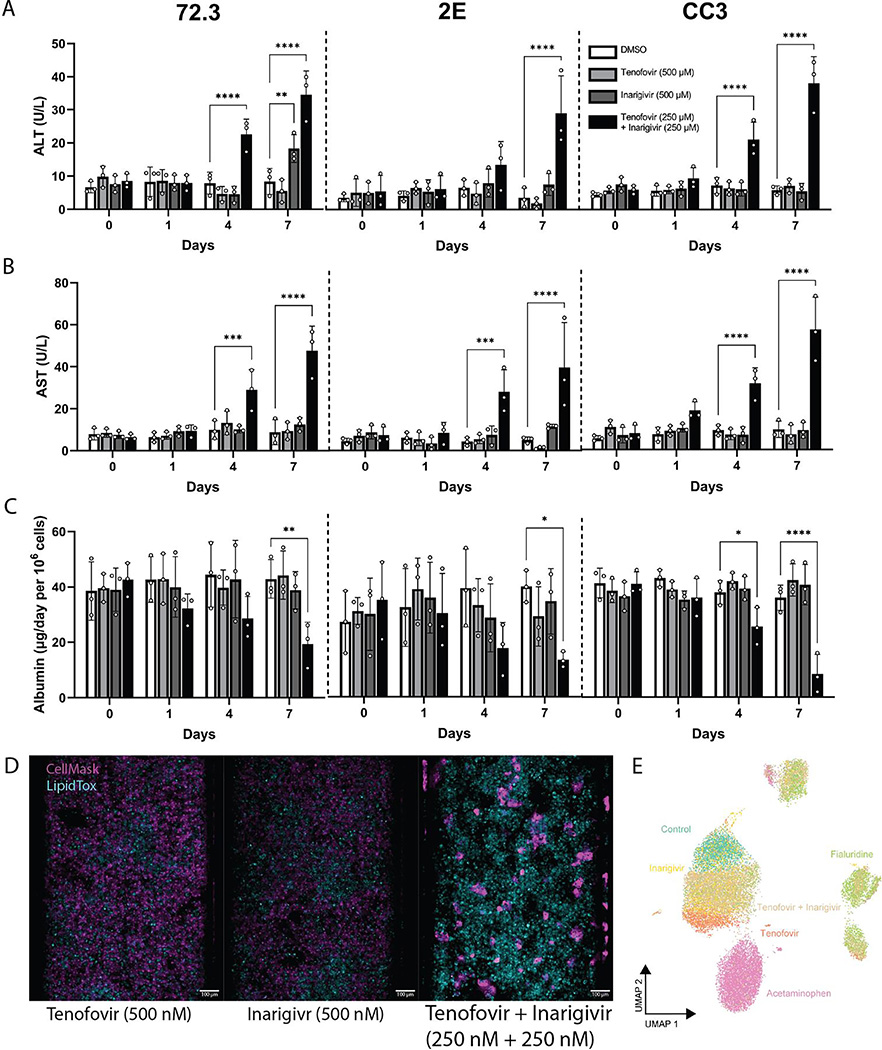
Fig. 3. Assessment of known DILI-causing drug combination: tenofovi-inarigivir.
(A) ALT, (B) AST, (C) and albumin released by 72,3, 2E, and CC3 PaDLOCs over 7 days of treatment with tenofovir (500 nM), inarigivir soproxil (500 nM), and tenofovir-xf inarigivir combination (250 + 250 nM) (n=3 chips per condition). Plot points represent mean ± SD. Statistical significance was calculated using ANOVA with multiple comparison Dunnett’s test. *, **, ***, and **** denote P values of less than 0.05, 0.01, 0.001, and 0.0001 respectively. (D) PaDLOCs treated with DMSO control, individual agents, combinations, APAP, and FIAU were stained with Hoechst 33342, CellMask Orange, and LipidTOX Deep Red. Images shown are scaled to identical intensity ranges. (E) CellProfiler extracted cell-level features were embedded into UMAP demonstrating morphological clustering. Plot points represent individual cells.

