FIG. 3.
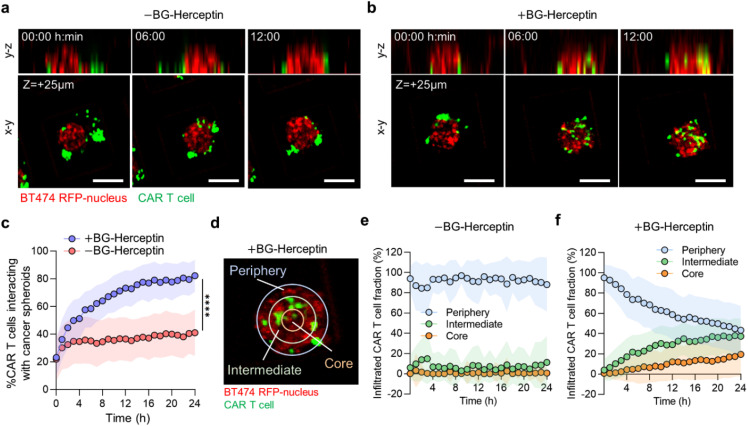
Sensing of HER2 on breast cancer cells by CAR T cells promotes CAR T cell infiltration within cancer spheroids. (a) and (b) Time-lapse confocal fluorescence imaging of y–z (side view) and x–y (top view) planes of CAR T cell-BT474 spheroid cocultures (a) in the absence and (b) presence of BG-Herceptin (HER2 sensing). Red: BT474 H2B-RFP and green: CMFDA dye-stained CAR T cells. The x–y plane images are captured at z = +25 μm from microwell bottom surface. Scale bars, 100 μm. (c) Sensing of HER2 increases the percentage of CAR T cells interacting with cancer spheroids. The percentage of interacting CAR T cells was calculated as the GFP area (CAR T cells) overlapping with RFP area (cancer cells) normalized by the total GFP area within a microwell. Plots represent mean SD. N = 145 microwells (+BG-Herceptin) and N = 91 microwells (−BG-Herceptin). ****p < 0.0001 (unpaired t-test analysis). (d) Spatial analysis of CAR T cell infiltration in cancer spheroids divided in three zones as a function of radial position. To define the periphery and intermediate zones, we set the difference between the inner and outer radii at 20 μm for each zone, while the core occupied the remaining area of each spheroid. (e) and (f) Spatial distribution of infiltrated CAR T cells over time (e) in the absence of BG-Herceptin and (f) in the presence of BG-Herceptin. Plots represent mean SD. N = 145 microwells (+BG-Herceptin) and N = 91 microwells (−BG-Herceptin). Results are representative of three biological replicates.

