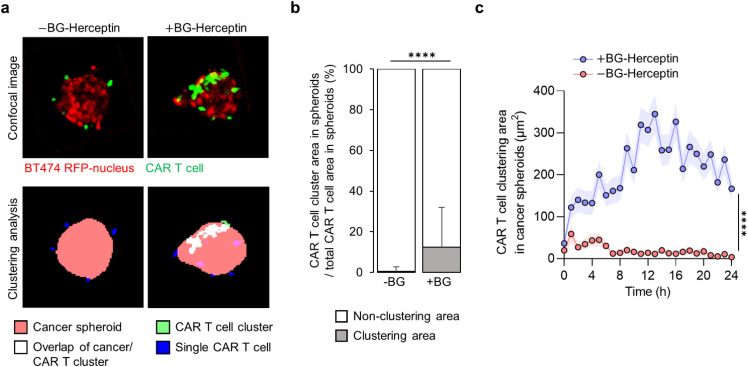
FIG. 4.
CAR T cell clustering within breast cancer spheroids depends on HER2 sensing. (a) Image analysis of CAR T cell clustering in cancer spheroids at z = +25 μm focal plane in the absence and presence of BG-Herceptin (HER2 sensing). Images in the top row are fluorescence images and images in the bottom row are segmentations based on cancer spheroid area (red), single CAR T cell area (blue), CAR T cell cluster area (green), and CAR T cell cluster area overlapped with cancer spheroid area (white). (b) Percentage of CAR T cell clustering area over total CAR T cell area in cancer spheroids at 24 h BG-Herceptin. Mean SD. N = 145 microwells (+BG-Herceptin) and N = 91 microwells (−BG-Herceptin). (c) The size of CAR T cell cluster area within cancer spheroids increases over time only when HER2 is sensed. Mean sem. N = 145 microwells (+BG-Herceptin) and N = 91 microwells (−BG-Herceptin). Results are representative of three biological replicates. ****p < 0.0001 (unpaired t-test analysis).

