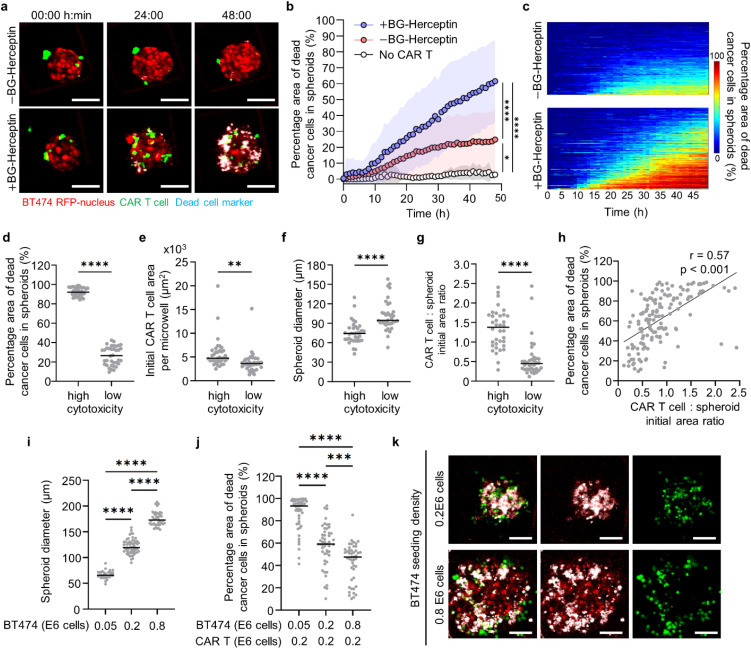
FIG. 5.
Dynamic profiling of CAR T cell cytotoxic killing reveals initial CAR T: spheroid ratio as a predictor of antitumor cytotoxicity. (a) Time-lapse confocal fluorescence images of CAR T cell—BT474 spheroid coculture at z = +25 μm in the absence and presence of BG-Herceptin. Red: BT474-H2BRFP, green: CMFDA dye-stained CAR T cells, and cyan: dead cell marker. Scale bars, 100 μm. (b) Quantification of cytotoxicity levels in BT474 cancer spheroids over time BG-Herceptin. Mean SD (−BG: N = 91; +BG: N = 145; and no CAR T +BG: N = 9 wells). (c) Heatmaps showing the temporal evolution of cytotoxicity for individual spheroids BG-Herceptin [Data from 91 microwells (−BG) and 145 microwells (+BG)]. Each row in the x-axis represents time and columns in the y-axis represent individual microwells. (d)–(g) Each dot is a spheroid and two groups are shown based on high (top quartile) and low (bottom quartile) cytotoxicity levels from +BG-Herceptin condition in panel c. Characterization of (d) cytotoxicity, (e) initial CAR T cell area, (f) initial spheroid diameter, and (g) initial CAR T cell:spheroid area ratio. **p < 0.01, ****p < 0.0001 (unpaired t-tests). (h) Correlation between cytotoxicity and initial CAR T cell:spheroid area ratio in microwells treated with BG-Herceptin (N = 145, Pearson correlation coefficient r = 0.61, p < 0.001). (i) Quantification of spheroid diameter in 300 × 300 μm microwells seeded with different cancer cell numbers. (N > 30 spheroids) (one-way ANOVA). ****p < 0.0001. (j) Quantification of cytotoxicity levels in microwells with different cancer cell seeding densities interacting with a fixed number of CAR T cells in the presence of BG-Herceptin (N > 46 spheroids from three biological replicates) (One-way ANOVA) ***p < 0.001, ****p < 0.0001. (k) Representative images of cancer spheroids with different seeding densities interacting with CAR T cells in the presence of BG-Herceptin at 48 h. Red: BT474-H2BRFP, green: CMFDA dye-stained CAR T cells, and cyan: dead cell marker. Scale bars, 50 μm.

