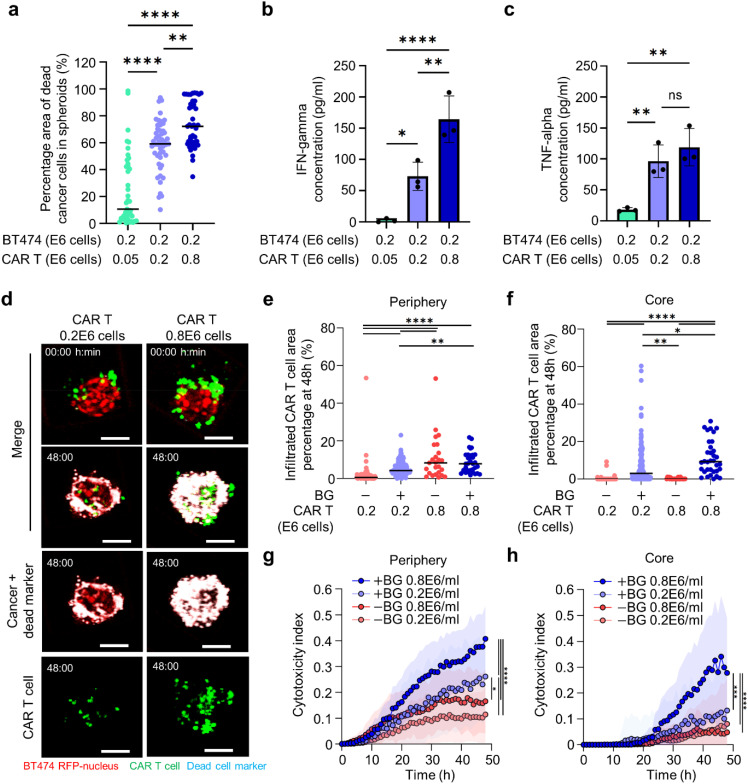
FIG. 6.
CAR T cell cytotoxicity within the spheroid core is enhanced by higher CAR T cell density when HER2 antigen is recognized. (a) Quantification of cytotoxicity in microwells seeded with different CAR T cell numbers for a fixed cancer seeding density in the presence of BG-Herceptin (N > 41 spheroids from three biological replicates) (one-way ANOVA) **p < 0.01, ****p < 0.0001. (b) and (c) Characterization of (b) IFN- and (c) TNF- secretion in microwells with different CAR T cell seeding densities. Three biological replicates (one-way ANOVA) *p < 0.05, **p < 0.01, and ****p < 0.0001. (d) Time-lapse confocal fluorescence imaging of CAR T cell-BT474 spheroid coculture in the presence of BG-Herceptin with different seeding densities (low: 0.2 × 10⁶ cells/ml and high: 0.8 × 10⁶ cells/ml) at 0 and 48 h. Red: BT474-H2BRFP, green: CMFDA dye-stained CAR T cells, and cyan: dead cell markers. Scale bars, 100 μm. (e) and (f) Quantification of the percentage of infiltrated CAR T cells out of the total CAR T cells in each spheroid at (e) the periphery and (f) in the core at 48 h BG-Herceptin with different CAR T cell seeding densities. (g) and (h) Cytotoxic index (definition in Methods) in (g) spheroid periphery and (h) core BG-Herceptin. Plots represent mean SD. −BG low (N = 91), +BG low (N = 145), −BG high (N = 25), and +BG high (N = 34). *p < 0.05, **p < 0.01, and ***p < 0.001 ****p < 0.0001 (one-way ANOVA analysis).

