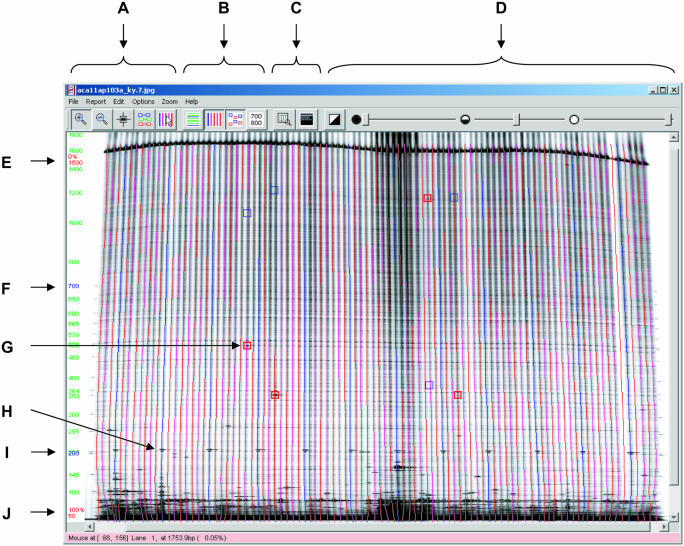
Figure 2.
Using GelBuddy to detect polymorphisms in 8-fold pooled Arabidopsis DNA. (A) Mode selection tools (zoom in, zoom out, edit signals, edit groups and edit lanes). (B) Detail selection tools (show calibration curves, show lanes, show signals and select channel). (C) Window tools (resize image to fit window and view log window). (D) Image adjustment tools (invert image, adjust black level, adjust gamma and adjust white level). (E) Adjustable upper limit marker. (F) Adjustable 700 bp calibration marker. (G) Recorded signals (foreground channel signals in red, background channel signals in blue). (H) Lane tracks. Blue lanes coincide with 200 bp marker DNA added to every eighth lane. (I) Adjustable 200 bp calibration marker. (J) Adjustable lower limit marker. Image is from the Seattle TILLING Project.

