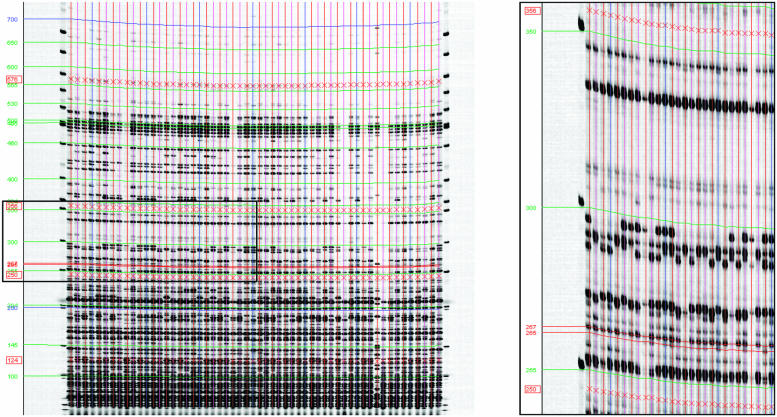
Figure 4.
GelBuddy lane calling and calibration of a typical AFLP gel image. Red ‘X’ marks indicate four calibration curves constructed by GelBuddy. Red, green and blue curves across width of gel indicate positions of equal mobility, interpolated from the calibration curves. Left: gel image of the full region of interest across all 56 lanes, where the straight lanes option was chosen. Right: an expansion of the boxed region of the left image displayed at a 1:1 pixel aspect ratio shows accurate calibration of two highly polymorphic fragments that are two bases apart in the 250–300 bp range. The AFLP LI-COR gel analyzer image of sorghum DNA was kindly provided by Patricia Klein (Texas A&M University).

