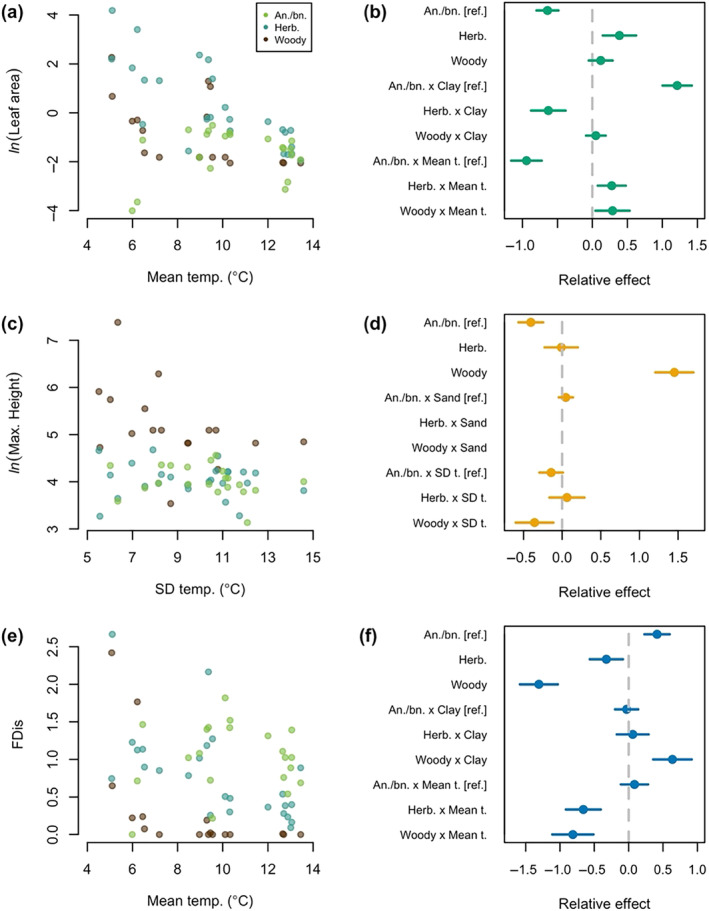
FIGURE 4.

Life‐history strategies affect the relationship between functional diversity and microenvironment. Plots in the left column show how the logged CWM of (a) leaf area, (c) maximum height, and (e) [unlogged] functional dispersion vary across the temperature variable they were most correlated with when subset by life‐history strategy—annuals/biennials (green), herbaceous perennials (blue), and woody perennials (brown). Plots in the right column—(b), (d), and (f)—show the relative effect of each explanatory variable in models that look at how these life‐history strategies affect the relationship between each functional metric (in the left column) and both the soil temperature and texture variable most correlated with that functional metric. Coefficient values are reference contrasts from those labeled as such. Values further from zero indicate that a variable or interaction between variables has a greater effect on a functional metric. For example, when a life‐history strategy interacts with one of the microenvironment variables and has a large relative effect, as woody and herbaceous perennials interact with mean temperature in (b), plants with these life‐history strategies have a larger impact on the relationship between that functional metric and microenvironmental variable.
