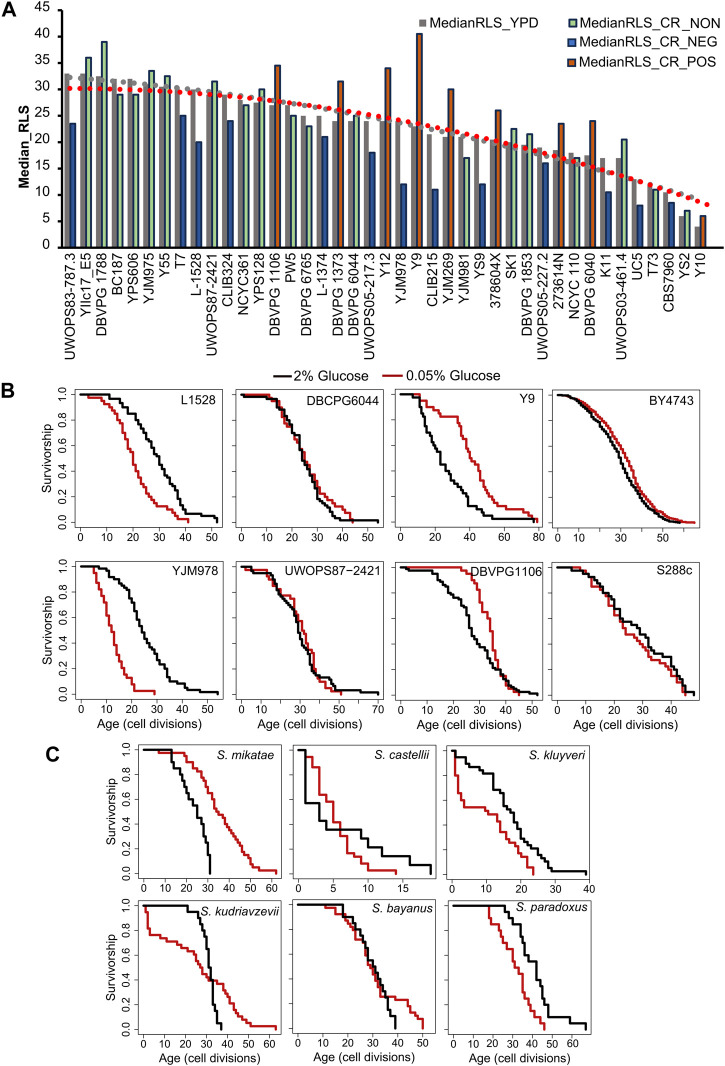
FIGURE 1.
Intra- and interspecies distribution of median RLS distribution. (A) Cells were grown in yeast peptone dextrose (YPD). Dashed lines represent the average median RLS of YPD (2% glucose gray) and YPD-CR (0.05% glucose). The bar graph depicts the media RLS of each strain analyzed under YPD (gray) and YPD-CR. Bar colors indicate CR response types based on the statistical significance of median RLS changes under CR conditions compared to the YPD. Blue is for negatively responding strains (NEG), green is for non-responding strains (NON), and orange bars represent positively responding strains (POS). (B) Examples of lifespan curves for the selected strains of Saccharomyces cerevisiae. (C) Lifespan curves for six Saccharomyces species. The black curve shows the lifespan under YPD conditions, and the red curve shows the lifespan under YPD CR conditions. The raw data and statistical significance can be found in Supplementary Material S1.

