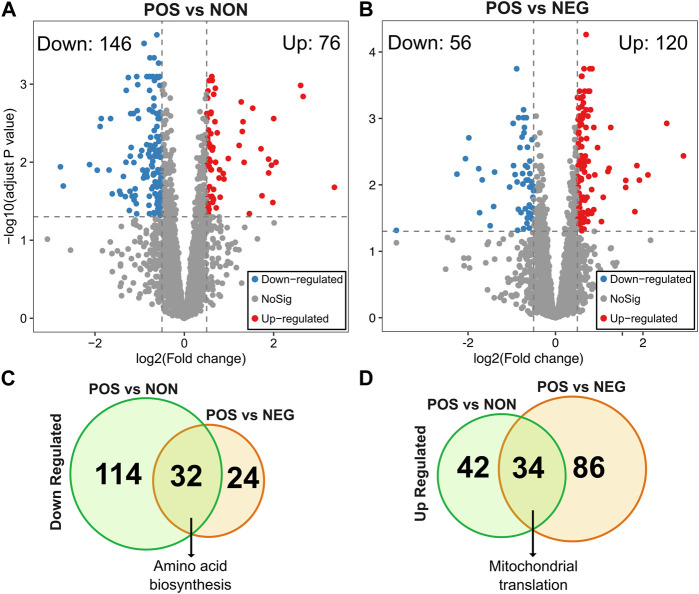
FIGURE 3.
Differentially expressed genes in POS group compared to the NON and NEG groups. The volcano plots depicting differentially expressed genes (DEGs) resulted in positively responding (POS) versus (A) non-responding (NON) groups and (B) negativelu-responding (NEG) groups. Red dots represent genes expressed at higher levels, while blue dots represent genes with lower expression levels in the POS group for each comparison. Gray dots represent genes that do not show significant differential expression between both groups. The gray line represents the cutoff of significant differential expression (adjust p-value <0.05 and log2 (Fold change) > 0.5). The Y-axis denotes −log10 (adjusted p-value) while the X-axis shows log2 (Fold change). Venn diagram shows the number of unique and common DEGs from each comparison (C) for downregulated and (D) for upregulated DEGs. The complete list of DEGs with p values can be found in Supplementary Material S2.

