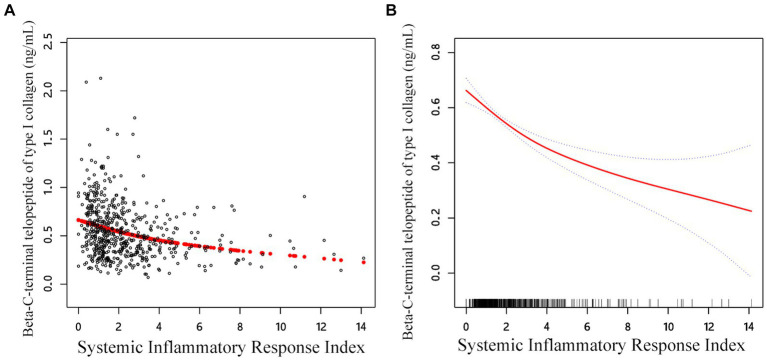
Figure 2.
Adjusted smoothed curve analysis revealing the interplay between SIRI and β-CTX: (A) Each black point represents a single participant sample. (B) Solid red line represents the smooth curve fit between variables. Blue bands represent the 95% of confidence interval from the fit. Age, sex, BMI, smoke, drink, CCI, hypertension, diabetes, HDL, TC, calcium, and platelet count were adjusted.

