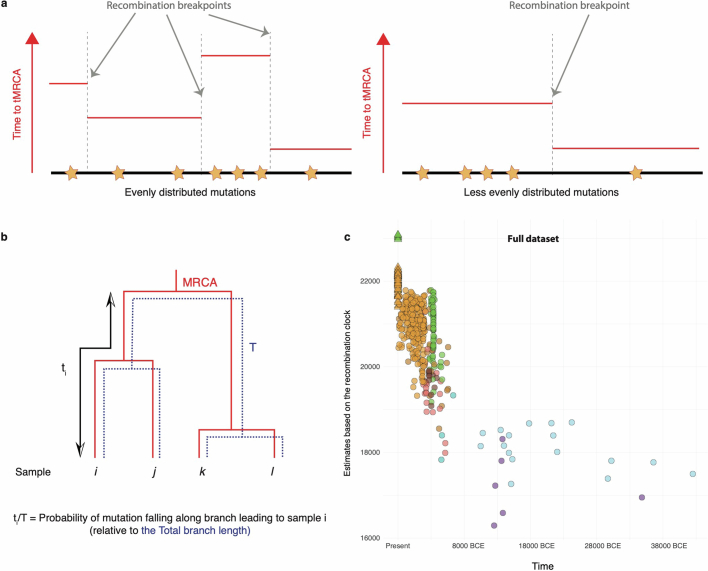
Extended Data Fig. 9. Recombination clock estimates.
a) Schematic representation that illustrates the expectation that the variance along the genome is greater in an older specimen (left) as the result of more generations of evolution and, hence, more recombination events than in younger specimens with regards to the time to the most common recent ancestor (MRCA) of the whole sample set. It is thus expected that the distribution of mutations (stars) is less even in the younger specimen (right), which underwent fewer recombination events, and thus carry longer haplotype blocks, in which mutations are equally likely to have occurred or not. b) Schematic visualization of the ti (time to the MRCA) and T (total length of the genealogy) parameters constituting the recombination clock model, for an illustrative sample of four genomes. c) Number of generations evolved from the MRCA, as estimated by applying the recombination clock model to the full data set.

