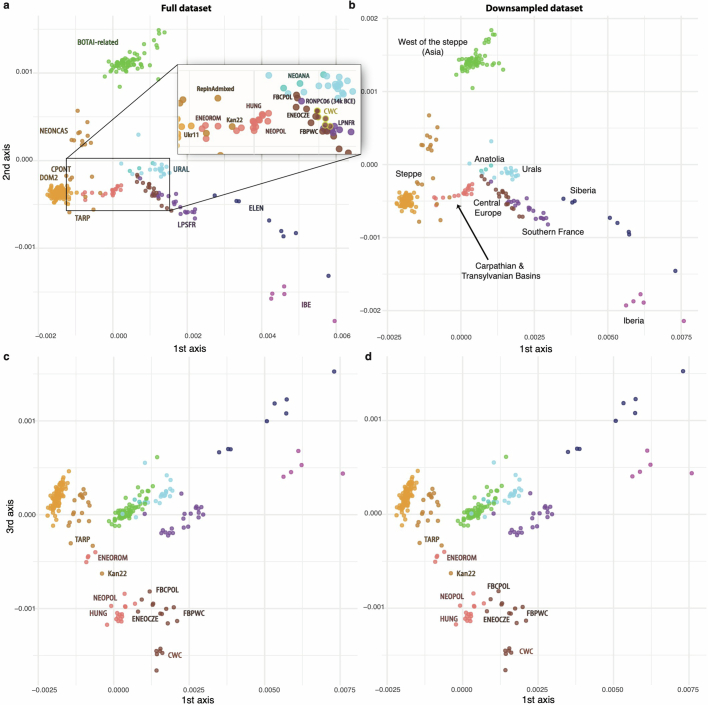
Extended Data Fig. 5. Visual embedding of Struct-f4 affinities.
a) The two first dimensions of a Metric MultiDimensional Scaling (MDS) analysis, summarizing the genomic affinities between horses, based on Struct-f4. To improve visualization, this excludes the five outgroup specimens. Samples are color-coded following Fig. 1a, and population groups are labelled accordingly. Horses projecting intermediate to large population groups reflect ancient clines of ancestry, stretching from the East (closer to Botai) to the West (closer to Europe). CPONT individuals, from the Central Steppe, are the closest to DOM2 horses. b) Same as a) for the downsampled dataset. c) First and third dimension of the same MDS analysis, which reveals CWC horses as the most distant European horses to DOM2 horses. d) Same for the downsampled dataset.

