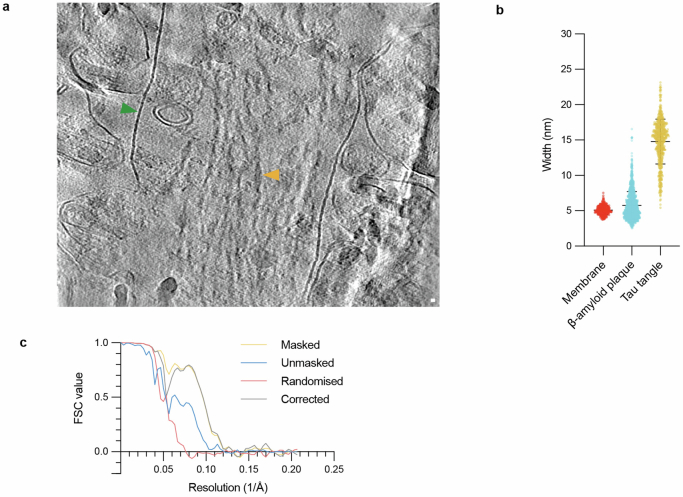
Extended Data Fig. 8. In-tissue cryoET of MX04-labelled tau inclusion cryo-section from AD post-mortem brain donor, amyloid width measurements, and FSC plot (related to Fig. 3h).
a, Tomographic slice through dystrophic neurite. Orange arrowhead, tau filament. Green arrowhead, plasma membrane of neurite. Scale bar, 10 nm. Related to Extended Data Fig. 3a and see Supplementary Video 6. b, Scatterplot showing the width distribution of lipid membrane (used as an internal control for width measurements, n = 296) and fibrils from in-tissue cryo-sections of β-amyloid plaques (n = 1360) and tau tangles (n = 561), respectively. Middle and top/bottom black bars indicate mean and one standard deviation. c, Resolution estimation of subtomogram averaging of tau subvolumes from a single tissue cryo-section by gold-standard Fourier shell correlation (FSC).

