
Fig. 4. cryo-CLEM-targeted cryo-FIB-SEM lift-out lamellae of tau thread in AD brain.
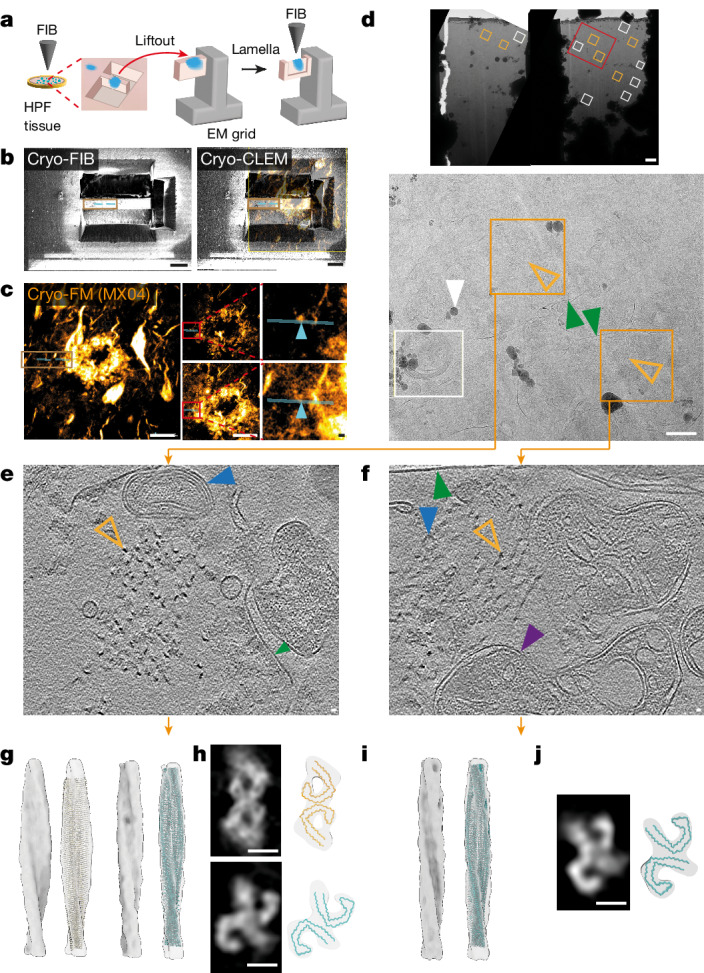
a, Schematic summarizing cryo-CLEM-targeted cryo-FIB-SEM lift-out lamellae preparation of MX04-labelled amyloid (blue) from HPF brain. b, Left, cryo-FIB image of HPF brain showing tissue chunk before lift-out. Right, cryo-FIB image aligned with confocal cryo-FM of MX04-labelled amyloid. Brown rectangle, tissue chunk; cyan line, locations of tissue lamella. Scale bar, 20 μm. c,e,f, The left shows MX04 confocal cryo-FM of HPF tissue targeted for preparation of lift-out lamellae. The middle shows cryo-FM optical z slices 1.9 μm apart. Scale bar, 20 μm. Red rectangles, regions in close-ups. The right shows close-ups. Cyan line, location of tissue lamella; cyan arrowhead, microscopic regions of MX04-labelled amyloid corresponding to locations above and below the first (e) and second (f) tomograms. Scale bar, 1 μm. d, Top, cryo-EM of two lift-out lamellae. Red rectangle, region enlarged below. Scale bar, 1 μm. Bottom, close up. Orange rectangle, tomograms of tissue lamella containing tau filaments; orange arrowhead, tau filament cluster; green arrowhead, plasma membrane-bound subcellular compartment; white arrowhead, ice contamination; white rectangle, location of tomogram lacking tau filaments. Scale bar, 500 nm. e,f, Tomographic slices of tau thread in tissue lamella. Orange arrowhead, tau filament; purple arrowhead, mitochondrion; green arrowhead, membrane enclosing subcellular compartment; blue arrowhead, intracellular membrane-bound organelle. Scale bar, 10 nm. g, Subtomogram averaging of 52 PHF and 19 SF. Left and middle left, averaged maps without and with tau PHF atomic model (yellow, PDB 5o3l)24 fitted into the subtomogram average map, respectively. Middle right and right, same as left and middle left but for SF without and with atomic model of ex vivo purified SF (cyan, PDB 5o3t)24. h, Helical averaging of tau filament subvolumes. Top and bottom panels, PHF and SF maps, respectively. Top left, slice through averaged subvolume. Top right, tau PHF Cα trace (yellow, PDB 5o3l) fitted using EM placement36,37 into an averaged map. Bottom left and right, same as top but for SF (cyan, PDB 5o3t)24. Scale bar, 5 nm. i,j, As in g (i) and h (j) but for the neighbouring SF only cluster.