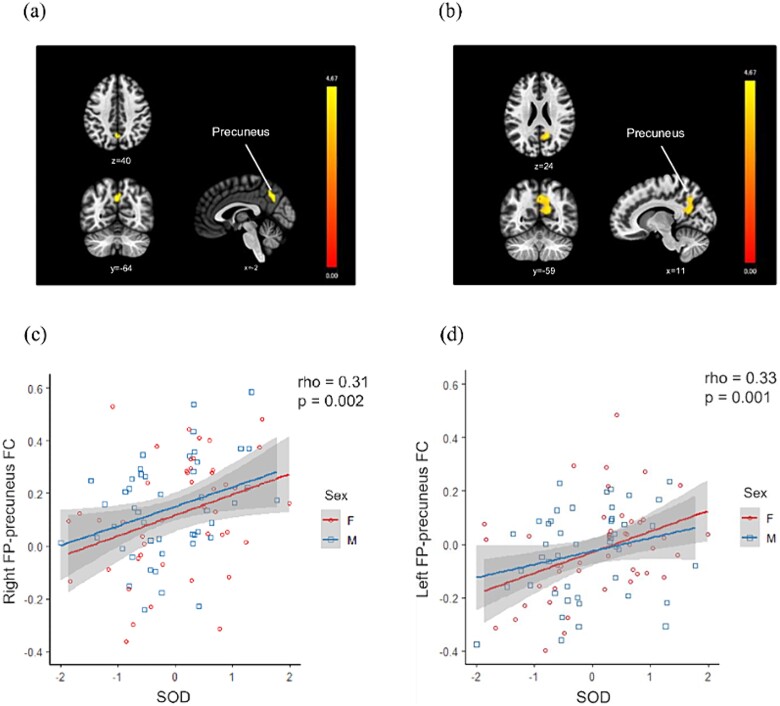
Fig. 1.
Association of SOD with a FP-seeded FC. (a, b) Brain regions showing significantly elevated (a) right and (b) left FP-seeded FC in the higher SOD group compared to the lower SOD group are depicted. The vertical bars represent t-values. (c, d) Relationships in all patients between SOD and these FCs are described. Abbreviations: SOD, self- and observer-ratings discrepancy; FP, frontal pole; FC, functional connectivity.

