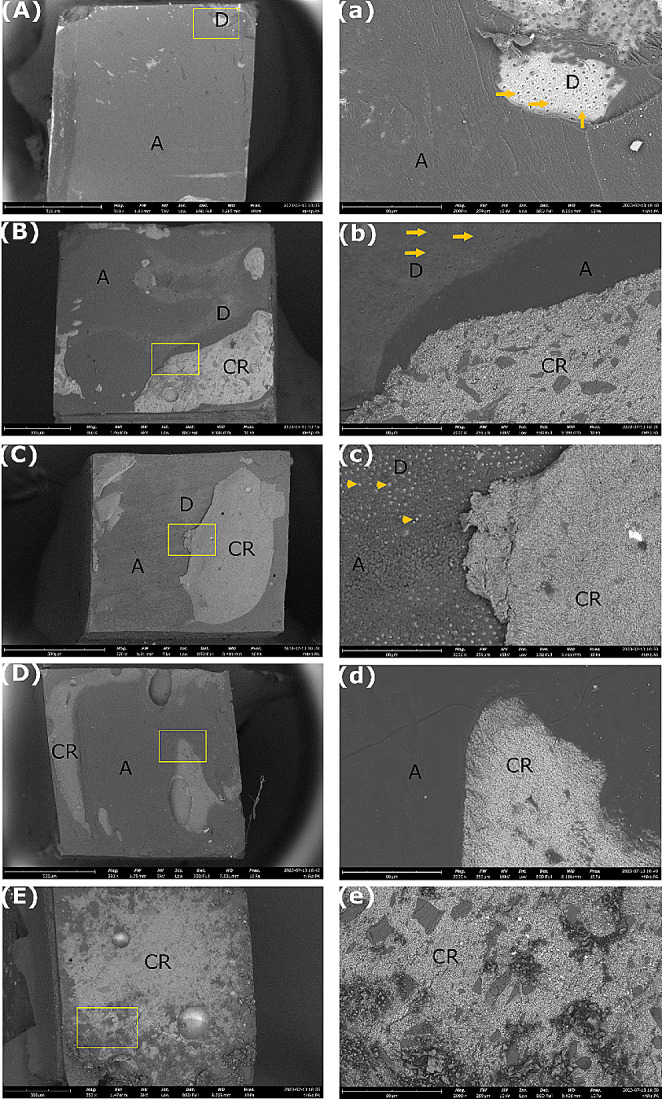
Fig. 4.

Representative SEM images of the fractured dentin surfaces at T0 (baseline). (A – E) Low magnification (500 X, bars: 500 μm) and (a – e) high magnification (2000 X, bars: 80 μm) of the areas limited by the yellow section in (A – E). (A) Negative control group with adhesive failure. (a) Presence of an adhesive layer and open dentin tubules. (B) Positive control group with mixed failure. (b) Presence of open dentin tubules, adhesive layer, and composite resin. (C) nHAp_PA 2% with mixed failure. (c) Presence of dentin tubules sealed by resin tags, adhesive layer, and composite resin. (D) nHAp_PA 6.5% with mixed failure. (d) Presence of adhesive layer and composite resin. (E) nHAp_PA 15% with cohesive failure in composite resin. (e) Presence of resin composite on the entire surface. Arrows: open dentin tubules. Arrowheads: dentin tubules sealed by resin tags. A: Adhesive. D: Dentin. CR: composite resin
