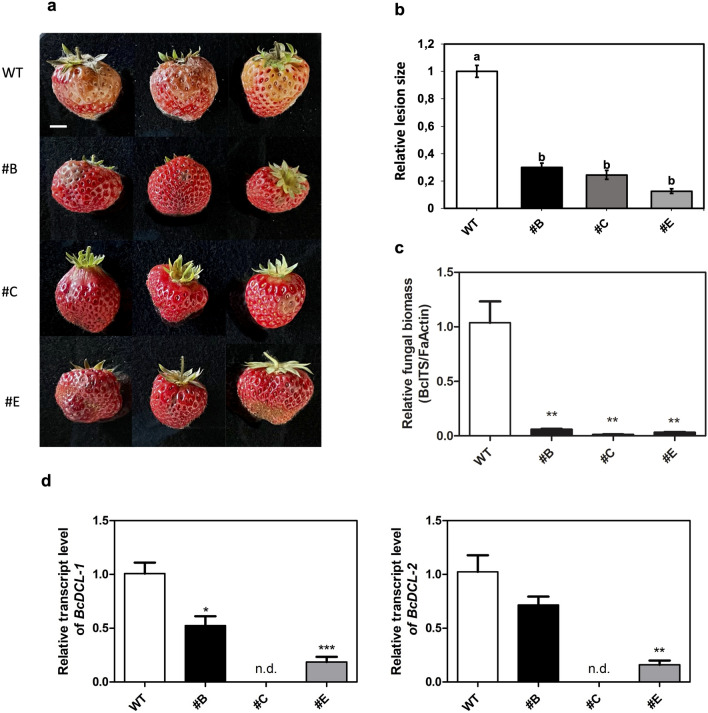
Fig. 6.
Reduced symptoms caused by B. cinerea in hp-Bc-DCL1/2 fruits targeting DCL1/2 genes. a Detached fruits from #B, #C, and #E hp-Bc-DCL1/2 lines compared to WT control, and b the relative lesion size measured after 4 dpi; c Relative fungal biomass analyzed by qPCR in inoculated fruits belonging to #B, #C, and #E hp-Bc-DCL1/2 lines and the WT control at 4 dpi; d BcDCL-1 (on the left) and BcDCL-2 (on the right) gene transcript quantification in inoculated fruits belonging to #B, #C, and #E hp-Bc-DCL1/2 lines and the WT control at 4 dpi, measured by qRT-PCR. For panel b means with different letters are significantly different according to the Student–Newman–Keuls (p ≤ 0.05) ± SE (n = 6). For panels c and d, the values reported are means ± SE (n = 3); n.d. means “not detectable”. Student’s t-test was applied to compare differences between hp-Bc-DCL1/2 lines and WT (*p < 0.05; **p < 0.01). Bar = 1 cm

