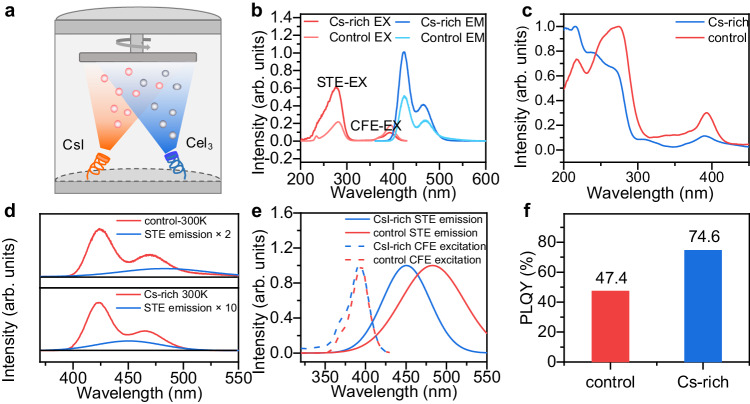
Fig. 2. Optical characterization of control and CsI-rich Cs3CeI6 film.
a Schematic diagram of Cs3CeI6 dual source co-evaporation. b The PL and PLE spectra of the Cs3CeI6 control and Cs-rich samples (EX for excitation and EM for emission). c The absorption spectra of the Cs3CeI6 control and Cs-rich samples. d The PL spectra and the calculated STE emission of the Cs3CeI6 control and Cs-rich samples. The red line represents the total spectrum and the blue line represents the STE spectrum obtained from the peak-differentiating. (fitted with Gaussian multimodal). e The excitation spectra of CFE and the emission spectra of STE and their overlapping areas in Cs3CeI6 control and Cs-rich samples. f The PLQY of 100 nm thick control and Cs-rich film.

