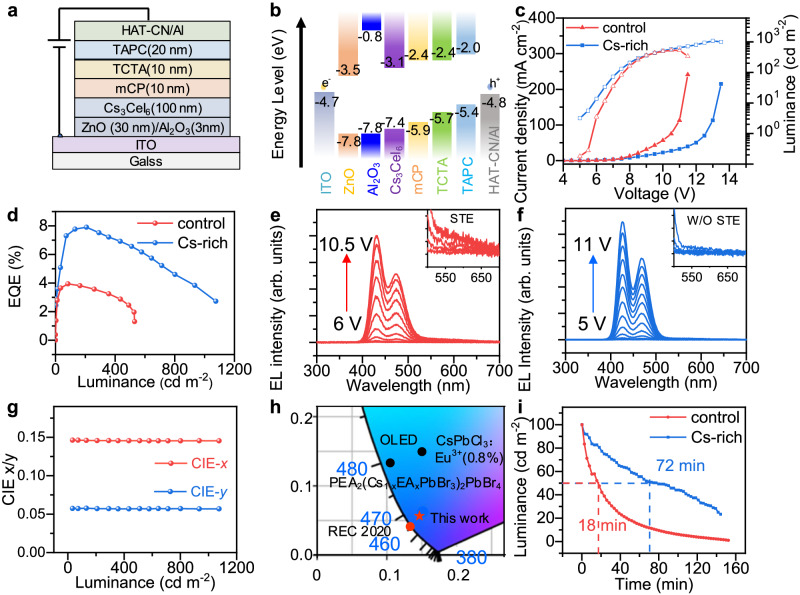
Fig. 4. Performance of RELEDs based on control and CsI-rich Cs3CeI6 films.
a Device structure of Cs3CeI6 RELED. b Flat band energy level diagram of Cs3CeI6 RELED. c Current density-voltage-luminance curve of Cs3CeI6 control and Cs-rich devices. d EQE-luminance curve of Cs3CeI6 control and Cs-rich devices. e EL spectra of the control LEDs under applied voltage from 6 V to 9.5 V. Inset shows the EL spectra of STE after 550–600 nm. The corresponding device voltage and brightness of the EL spectrum taken in the illustration are (7 V, 35 cd m−2), (7.5 V, 83 cd m−2), (8 V, 164 cd m−2), (8.5 V, 260 cd m−2). f EL spectra of the Cs-rich LEDs under applied voltage from 5 V to 11 V. Inset shows CFE emission spectra without STE after 550 nm. The corresponding device voltage and brightness of the EL spectrum taken in the illustration are (6.5 V, 33 cd m−2), (7 V, 72 cd m−2), (7.5 V, 141 cd m−2), (8 V, 207 cd m−2). g The Commission Internationale de l’Éclairage (CIE) coordinates of Cs-rich device’s EL spectra at various luminance. h The CIE comparison of Cs3CeI6-RELEDs with Rec. 2020 standard for the blue emitter and some representative deep-blue LEDs reported so far. The CIE values of Ce-complex11, OLED31, CsPbCl3:Eu3+ nanoparticles32, and PEA2(Cs1-xEAxPbBr3)PbBr429 are reported by previous literature. i The device stability under a continuous voltage of 8 V for Cs3CeI6 control devices and 7.5 V for the Cs-rich device.

