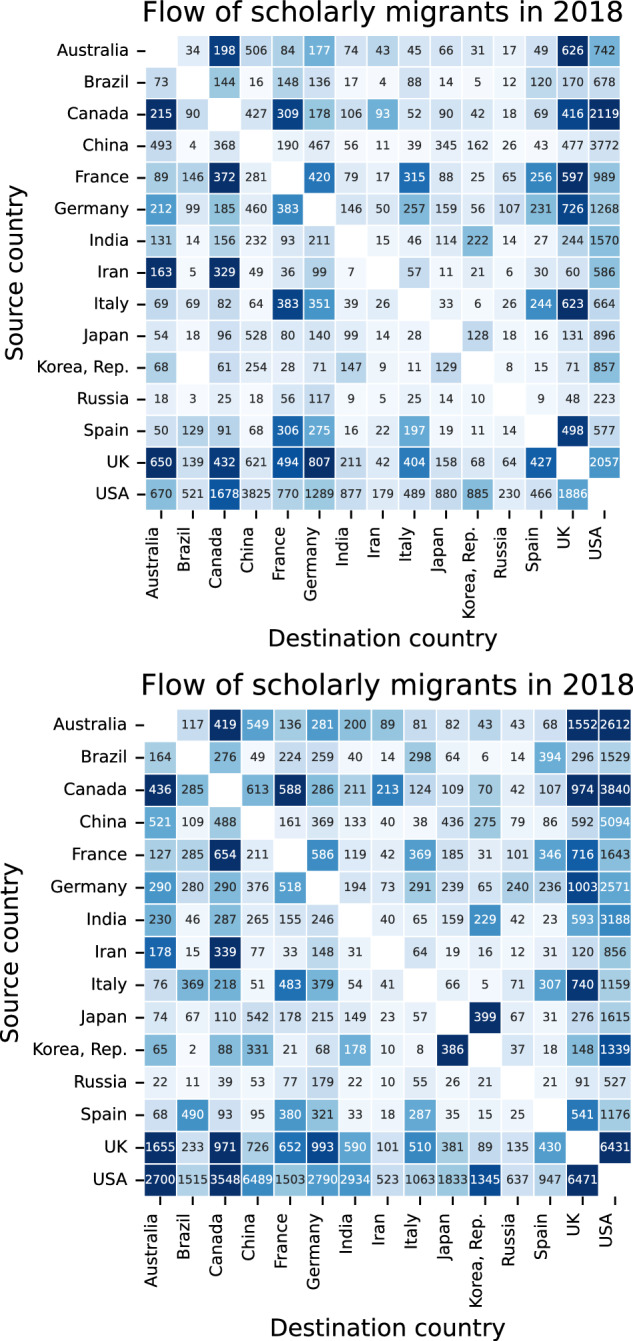
Fig. 4.

Bilateral flows of scholarly migration between the 15 pairs of countries with the highest exchanges based on Scopus (top) and OpenAlex (bottom). The numbers printed in cells are the actual count of scholars who moved from the source country (Y-axis) to the destination country (X-axis). The colors are based on the normalized flow of migrants. Normalization is done by dividing the total flow of scholars between each country pair by the total outflow from the source country times the total inflow to the destination country.
