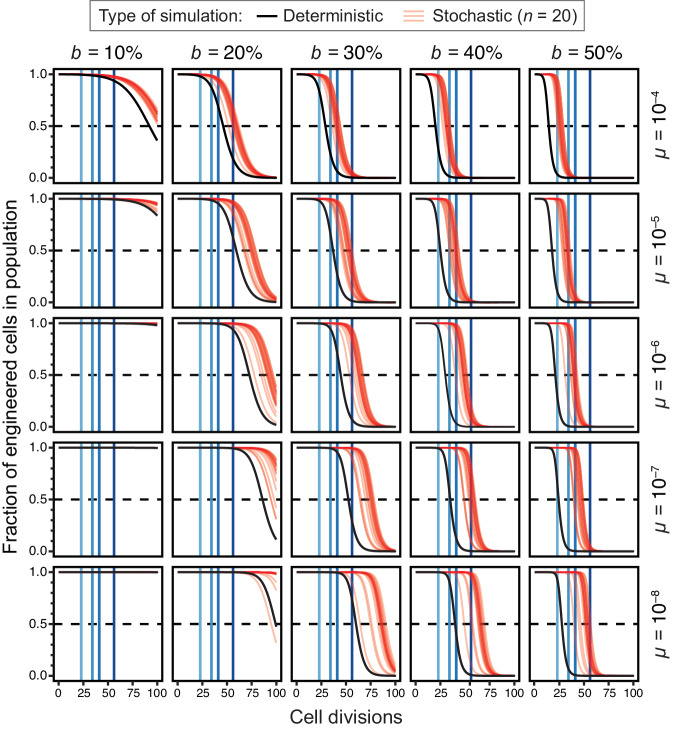
Fig. 2. Simulations of evolutionary failure times for populations of engineered cells.
In each panel, the results for deterministic (black) and stochastic (red) simulations of the failure model are shown for one combination of burden (b) and failure mutation rate (µ) parameters. Vertical blue lines represent the culture scales shown in Fig. 1C. Curves for stochastic simulations are partially transparent so that one appears pink and overlapping trajectories from multiple simulations appear red. Twenty stochastic simulations are displayed in each panel.

