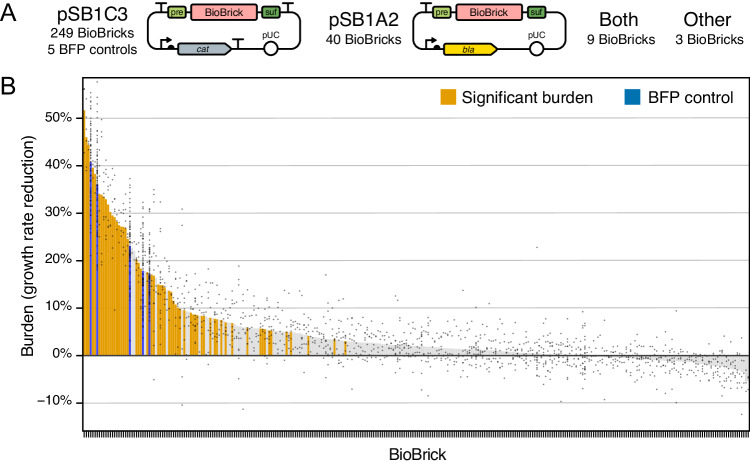
Fig. 4. Measurements of BioBrick burden.
A Maps of the two plasmid backbones that housed most of the 301 BioBricks that were tested and the five BFP controls that were included in every assay. The prefix (pre) and suffix (suf) multiple cloning sites used in BioBrick assembly are shown. B Burden of each BioBrick tested. Burden is the percentage reduction in the growth rate of E. coli cells transformed with a BioBrick plasmid. Gray points are individual measurements. Bars are the means for all measurements of a BioBrick. For BioBricks with orange bars, the measured burden was significantly greater than zero (adjusted p < 0.05, one-tailed t-tests with Benjamini–Hochberg correction for multiple testing). Supplementary Data 2 contains the results of all microplate assays. Supplementary Data 3 has calculated statistics. Source data are provided with this paper.

