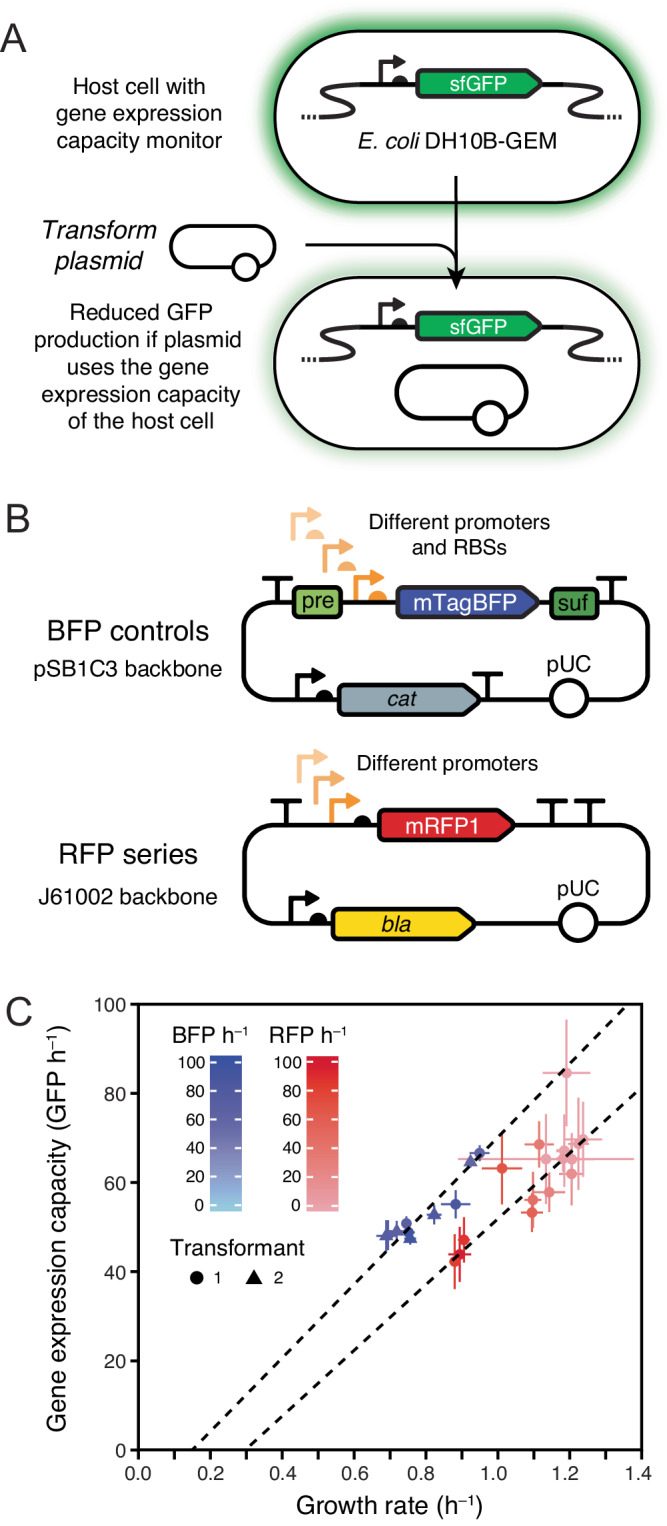
Fig. 6. Expression of recombinant proteins from a plasmid reduces the growth rate of E. coli because it diverts some of its capacity for gene expression.

A E. coli DH10B-GEM host strain with the gene expression capacity monitoring device that constitutively expresses GFP integrated into its chromosome. B Maps for the BFP and RFP plasmid series. C Growth rates and fluorescent protein production rates for different BFP and RFP plasmids in E. coli DH10B-GEM. Dashed lines are Deming regressions showing that the reduction in growth rate is proportional to the reduction in the capacity of the host cell for protein expression within each set of strains. The rate of GFP production from the monitoring device is used as a readout of gene expression capacity. Rates of BFP and RFP production in cells with each type of plasmid are indicated by shading in the respective color. Means are plotted with error bars that are 95% confidence limits. Two independent transformants of each BFP plasmid that were tested separately are displayed as points with different shapes. There were eight technical replicates (microplate wells) for each BFP plasmid transformant and four for each RFP plasmid tested. GFP and BFP production rates were measured on different relative scales and each series uses a different vector backbone and was measured under different growth conditions, so results should only be compared within each series. Growth rates, GFP production rates, and RFP/BFP production rates for individual plasmids are plotted in Supplementary Fig. 7. Supplementary Data 5 contains the results of all microplate assays, and Supplementary Data 6 has calculated statistics. Source data are provided with this paper.
