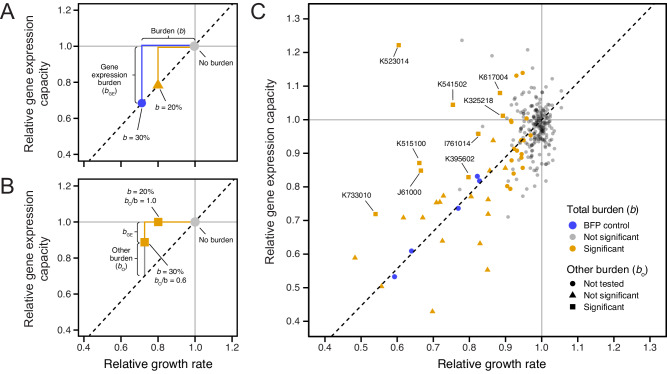
Fig. 7. Some BioBricks exhibit burden from sources other than gene expression.
A Examples of expected results for two BioBricks that exhibit burden (b) that is wholly due to utilizing the gene expression capacity of the host cell. The reduction in growth rate is proportional to the reduction in GFP production according to a linear relationship (dashed line) that is established from measurements of control strains. B Examples of expected results for two BioBricks that exhibit burden from sources other than gene expression. C Mean growth rates and GFP production rates measured for 259 BioBricks that do not contain fluorescent proteins that are expected to interfere with measuring GFP fluorescence in the E. coli host strain containing the gene expression capacity monitor. Points for each BioBrick are colored based on whether the burden (reduction in growth rate) was significantly greater than zero (one-tailed t-tests, Benjamini–Hochberg adjusted p < 0.05). Symbols indicate whether the null hypothesis that all burden was due to utilizing the gene expression capacity of the host cell could be rejected (one-tailed t-tests, Benjamini–Hochberg adjusted p < 0.05). Only the 26 BioBricks with burden significantly greater than zero, a mean estimated burden >10%, and no interference from other fluorescent proteins were tested. BioBricks with significant burden from sources other than gene expression are labeled with their accession numbers. Estimates of bo/b for these BioBricks are shown in Table 1. Source data are provided with this paper.

