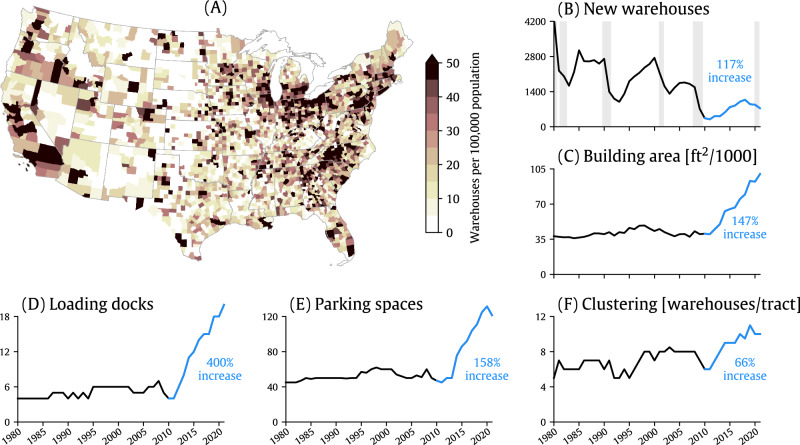
Fig. 1. Spatial distribution of U.S. warehouses and trends in warehouse characteristics.
A The number of warehouses per capita in U.S. counties as of 2021. Time series in (B–F) highlight trends in the total number of new warehouses constructed and warehouse characteristics (e.g., building area, loading docks, etc.), indicated by the median value of the characteristic for all warehouses built during the calendar year. The blue portion of the time series and corresponding text highlight relative changes between 2010 and 2021. Gray shading in (B) denotes the dates of U.S. recessions as inferred by a gross domestic product-based recession indicator57.

