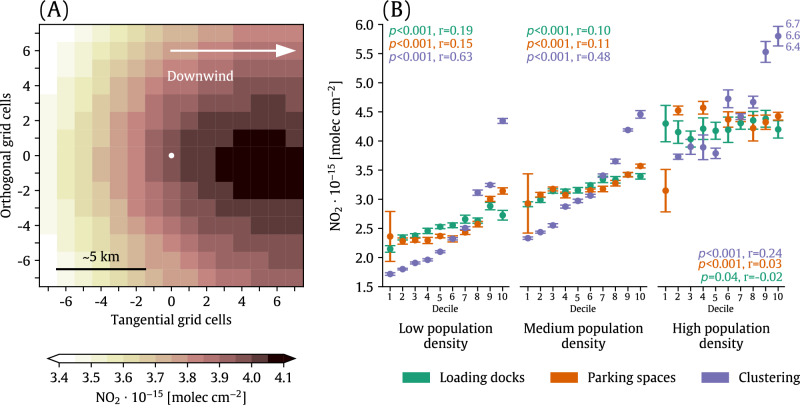
Fig. 2. Spatial variations and role of warehouse characteristics in near-warehouse NO2 enhancements.
A Annual average 2021 TROPOMI NO2 composited over all warehouses in the contiguous U.S. The white scatterpoint corresponds to the location of the warehouses, and the ±7 grid cell buffer around the warehouse represents our definition of the “near warehouse” environment. B Median NO2 levels (scatterpoints) and the 95% confidence interval (vertical bars) formed by discretizing warehouses that comprise the composite shown in (A) into deciles based on their number of loading docks, parking spaces, and the number of warehouses in each census tract (“clustering”) for different population density classifications. Inset text indicates the p-value (p) calculated using a two-sided Wald test with a t-distribution of the test statistic and the Spearman’s rank correlation coefficient (r) of the relationship between NO2 and property characteristics but calculated using the full dataset, rather than the deciles. Median NO2 levels and the associated confidence interval for the top clustering decile in high population density areas are out of the frame and are shown alongside the plot.

