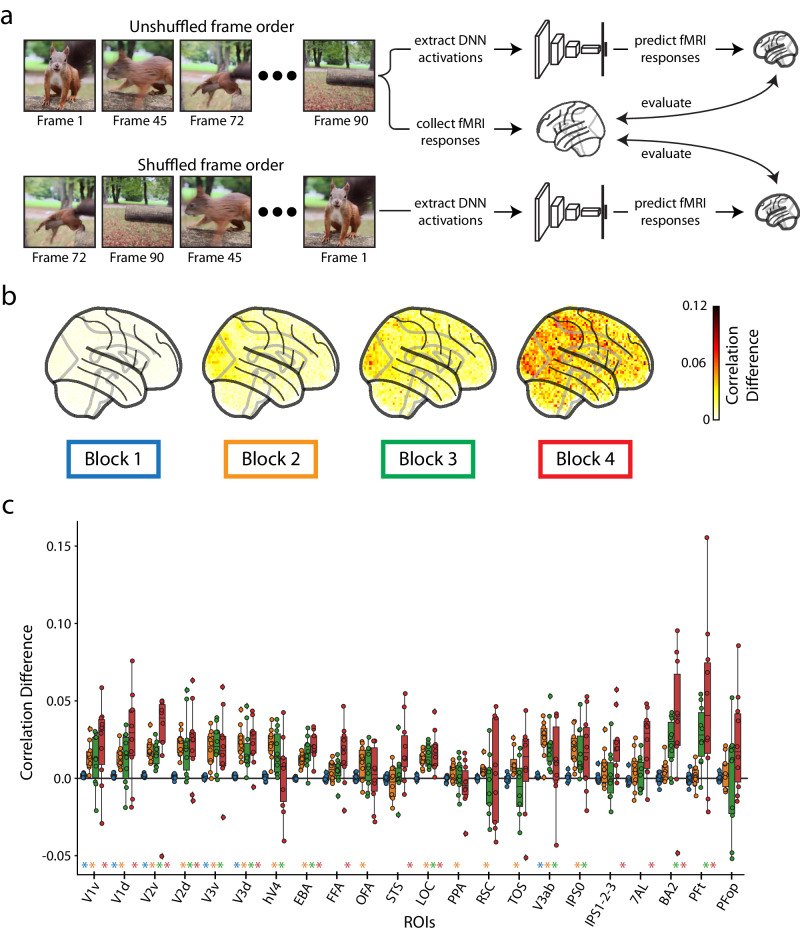
Fig. 5. Importance of temporal order in predicting fMRI responses.
a Frame shuffling procedure: We predict the real fMRI responses using both the DNN activations of the original (unshuffled) frame order and the DNN activations of the randomly shuffled frame order. A difference in prediction accuracy between the DNN activations of the unshuffled and shuffled frames indicates the preservation of correct temporal order in the fMRI response. Video frames are cropped from a representative video by NaIzletuSi ™ (YouTube: https://www.youtube.com/watch?v = QT0o0fTfZKE, CC BY 3.0 license: https://creativecommons.org/licenses/by/3.0/legalcode). b Whole-brain prediction difference: Difference in the correlation averaged over participants between the shuffled framed prediction accuracy and unshuffled frame prediction accuracy across the whole brain at different DNN layers (TSM model). c ROI-based prediction difference: Difference in the correlation between the shuffled frame prediction accuracy and unshuffled frame prediction accuracy at different ROIs and DNN layers (TSM model). A colored asterisk along the x-axis indicates significant difference between the unshuffled and shuffled prediction accuracy at that DNN block (p < 0.05, one sample two-sided t-test against a population mean of 0, FDR correction across 22 ROIs x 4 blocks=88 comparisons). Source data are provided as a Source Data file. The box plot and asterisks are colored blue, orange, green, and red for blocks 1 – 4, respectively. The box plot encompasses the first and third data quartiles and the median (horizontal line). The whiskers extend to the minimum and maximum values within 1.5 times the interquartile range, and values falling outside that range are considered outliers (denoted by a diamond). The overlaid points show the value at each observation (n = 10 for all ROIs except transverse occipital sulcus (TOS, n = 8) and retrosplenial cortex (RSC, n = 9)).

