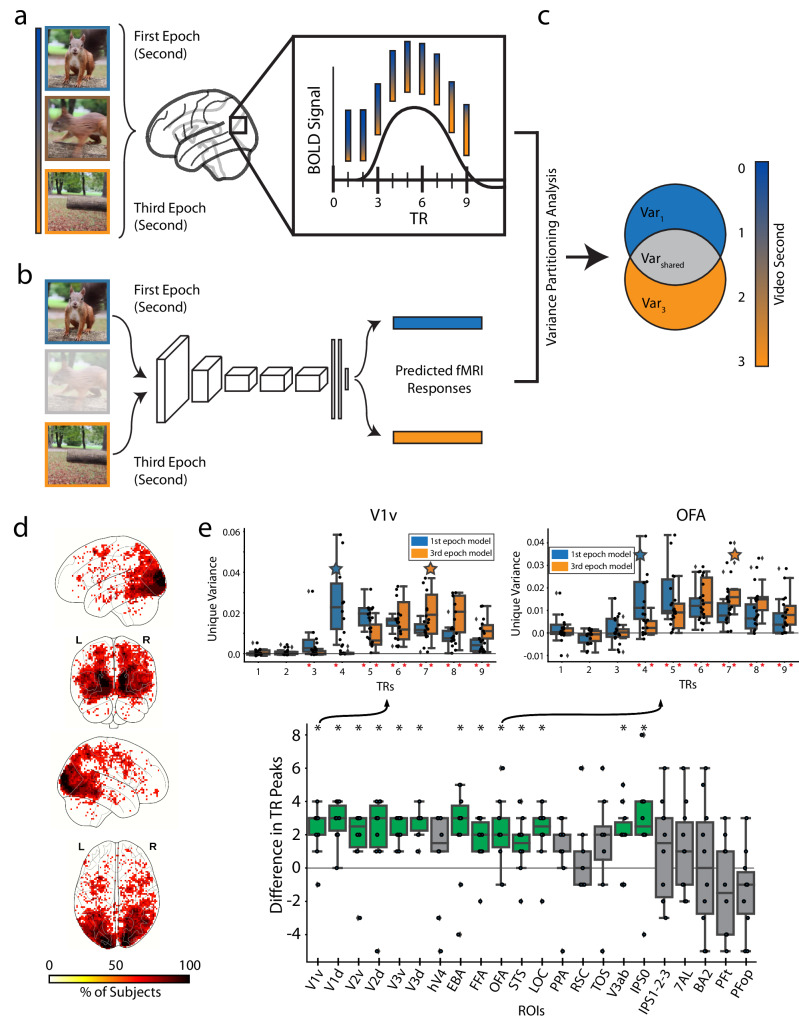
Fig. 6. Encoding the temporal dynamics of the BOLD signal.
a TR estimated fMRI responses: We estimate the video-evoked brain response (beta values) of the first 9 TRs of the BOLD signal. Video frames are cropped from a representative video by NaIzletuSi ™ (YouTube: https://www.youtube.com/watch?v = QT0o0fTfZKE, CC BY 3.0 license: https://creativecommons.org/licenses/by/3.0/legalcode). b DNN predicted fMRI responses: We use an encoding model to extract DNN activations from the first video second (first epoch, blue) and third video second (third epoch, orange), then predict fMRI responses. Video frames are cropped from a representative video by NaIzletuSi ™ (YouTube: https://www.youtube.com/watch?v = QT0o0fTfZKE, CC BY 3.0 license: https://creativecommons.org/licenses/by/3.0/legalcode). c Variance partitioning analysis: We calculate the unique variance explained by the first and third video epochs’ predicted fMRI responses at each TR. d Whole brain analysis: Each voxel shows the percentage of subjects with a TR peak difference of 1 to 3 TRs. Only significant voxels are plotted (p < 0.05, one-sided binomial test, FDR corrected). e ROI analysis: Upper ROI panels: We show the unique variance explained by the predicted fMRI responses of the first (blue) and third (orange) video epoch at TRs 1-9 in representative ROIs first visual area ventral (V1v) and occipital face area (OFA). Red asterisks indicate significance greater than 0 (p < 0.05, one-sample one-side t-test, FDR corrected across 9 TRs x 2 video epochs=18 comparisons). Blue/orange stars indicate the TR with the maximum subject averaged unique variance for the first/third video epochs, respectively. Source data are provided as a Source Data file. Main ROI Panel: We compute each subject’s TR peak difference by subtracting the first video epoch’s maximum TR from the third video epoch’s maximum TR at each ROI. Green bars with asterisks indicate significant differences greater than 0 (p < 0.05, one-sample two-sided t-test). Source data are provided as a Source Data file. The box plot shows the first and third quartiles, median (horizontal line), and whiskers extending to 1.5 times the interquartile range. Outliers (diamonds) and individual observations are also shown (n = 10 for all ROIs except transverse occipital sulcus (TOS, n = 8) and retrosplenial cortex (RSC, n = 9)).

