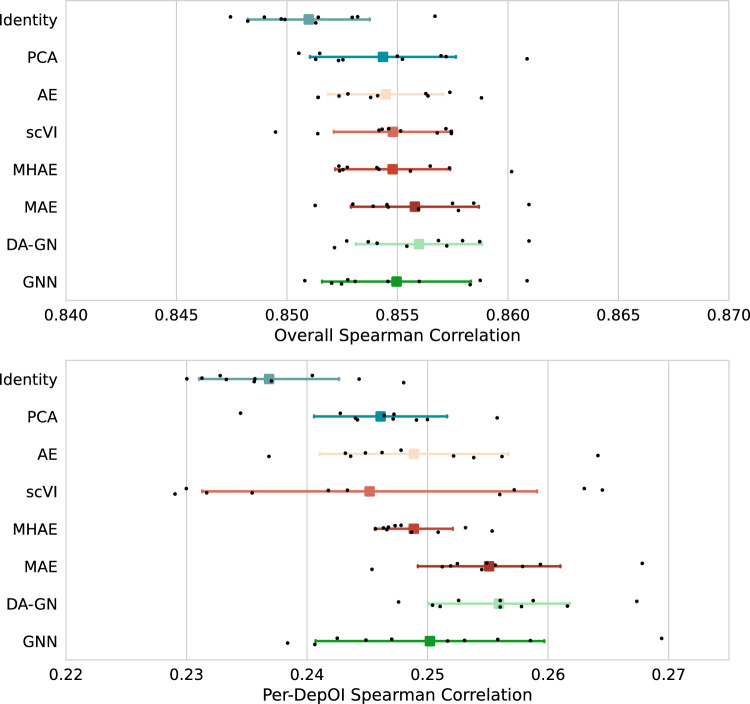
Figure 3.
Comparison of performance on gene essentiality prediction task on DepMap dataset for different bulk RNA-seq representation models. (Top panel) Spearman Rank correlation distributions between predicted and observed gene essentialities: black dots represent results on different test folds. For each model, mean (square) Spearman Rank and standard deviation (intervals) are represented. Models are evaluated on their capacity to rank combinations of cell line and DepOI based on their gene essentiality score. (Bottom panel) Same as Top panel, but correlation computed per-DepOI. In this case, models are evaluated on their capacity to rank cell lines based on their gene essentiality score for that particular DepOI. The 1223 correlations are averaged to produce a single score per-DepOI correlation.

