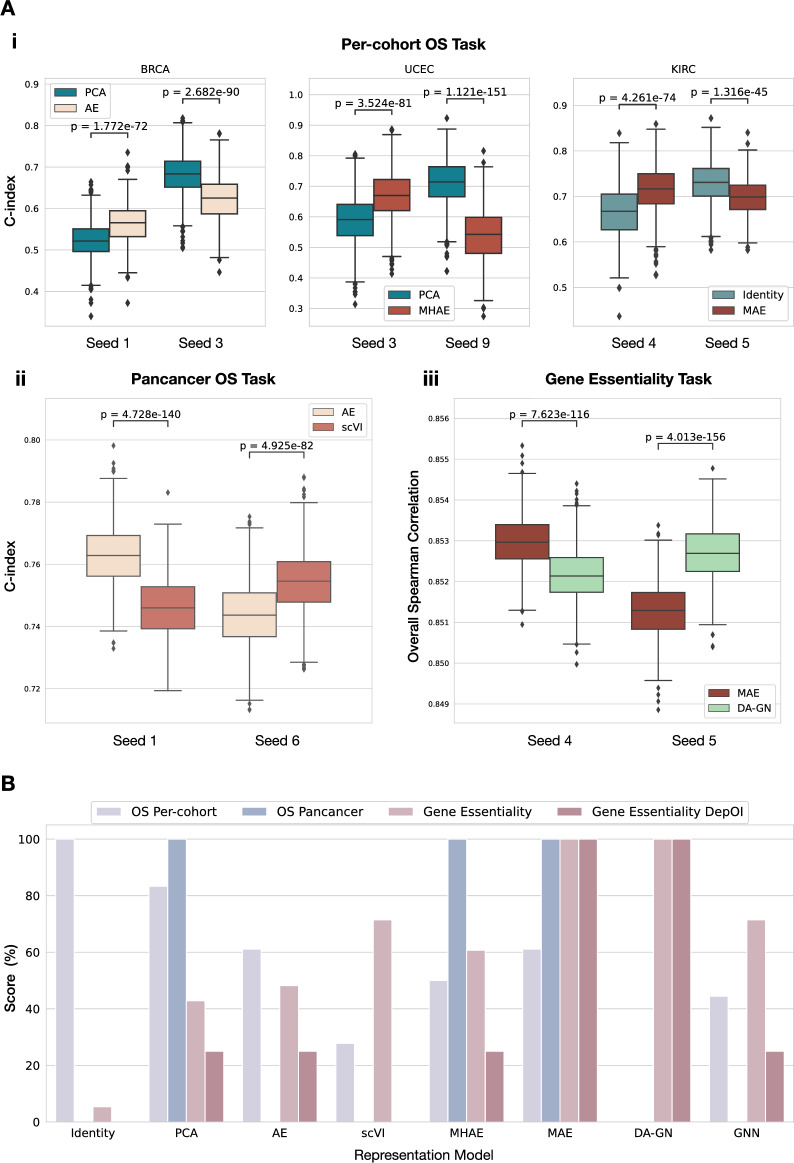
Figure 4.
Comparison of model evaluation processes. (A) Test metric distributions obtained with bootstrap (n = 1000 per seed) on the test sets generated by different seeds on the downstream tasks. Models were trained following our repeated holdout pipeline, but graphs show results only on arbitrary chosen individual test sets to showcase the limitations of this evaluation process. p-values are computed using Wilcoxon tests. (i) Comparison of representation models on 3 example cohorts from the per-cohort OS prediction task. (ii) Comparison of AE and scVI on the pan-cancer task. (iii) Comparison of MAE and DA-GN on the Gene Essentiality task. (B) Overall comparison of the different representation models over the tasks Per-cohort OS Prediction, Pan-cohort OS prediction and gene essentiality (overall metric and per-DepOI). The score for a given model corresponds to the number of winning pairwise comparisons to other models according to our acceptance test criteria. The sum is then normalized by task to obtain the final score and is expressed as a percentage.

