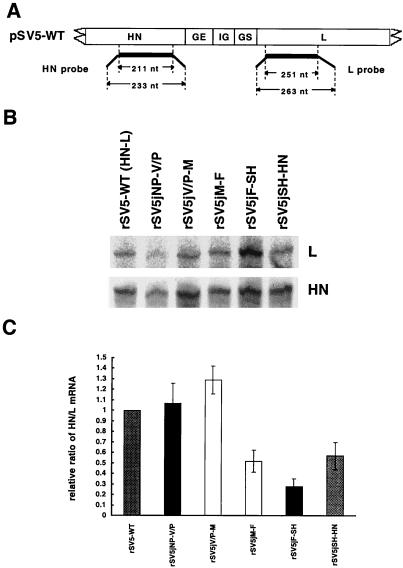
FIG. 3.
RPA analysis of the levels of HN and L mRNA. (A) Schematic diagram of the probes. The sizes (in nucleotides [nt]) of the RNA probes and the protected fragments are shown. The thin line at the end of each probe represents sequences that will not hybridize to the target mRNAs, enabling distinction of the probes and the protected fragments. (B) RNA protected fragments for HN and L mRNAs. [α-32P]UTP-labeled specific RNA probes as indicated in panel A were synthesized as described in Materials and Methods. RPAs were carried out with the HN and L probes simultaneously in the same reaction, and both protected fragments were resolved in the same lane of a polyacrylamide gel. To obtain similar levels of exposure for the two protected species, two different exposures of the gels were used. (C) The HN/L mRNA ratio for each experiment, quantified with a Storm Image system. To compare different experiments, the HN/L mRNA ratio of each rSV5 was normalized to the HN/L mRNA ratio of wt rSV5, set as 1. The relative ratio of HN/L mRNA from five different experiments ± standard error of mean was obtained and is shown in the histogram. Numerical values are 1.07 ± 0.43 for rSV5jNP-V/P, 1.29 ± 0.30 for rSV5jV/P-M, 0.52 ± 0.23 for rSV5jM-F, 0.28 ± 0.16 for rSV5jF-SH, and 0.57 ± 0.29 for rSV5jSH-HN.

