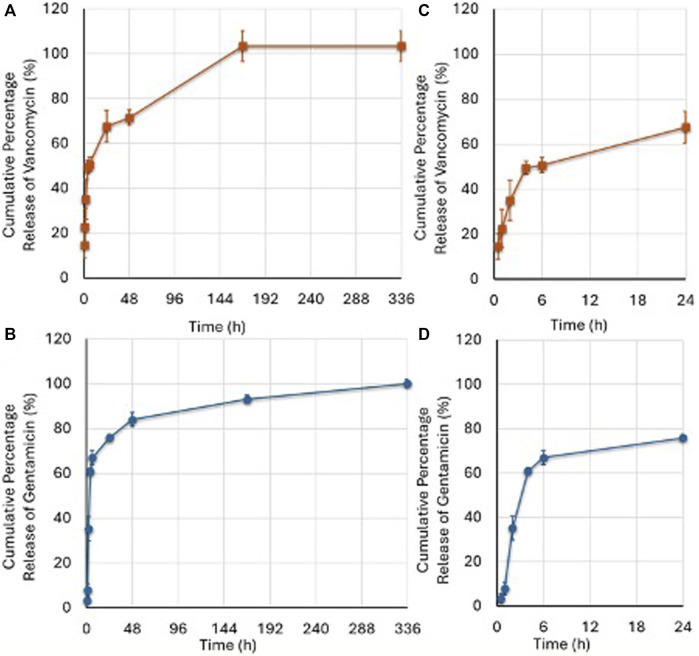
FIGURE 4.
Vancomycin (A) and Gentamicin (B) released at different timepoints as percentage of the drug initially loaded. The amount of released vancomycin and gentamicin was calculated according to the amount (1 mg) loaded into the G. The (C,D) images represent the boost release of the two antibiotics over a 24-h period. (Mean ± SD, n = 3). Two-ANOVA (F = 134.9, p < 0.0005): Vancomycin release was higher than Gentamicin at 0.5 (p = 0.008); 1 (p = 0.008); and 168 (p = 0.014) hours; Gentamicin release was higher than Vancomycin at 4 (p = 0.008); 6 (p < 0.0005); 24 (p = 0.045); and 48 (p = 0.034) hours.

