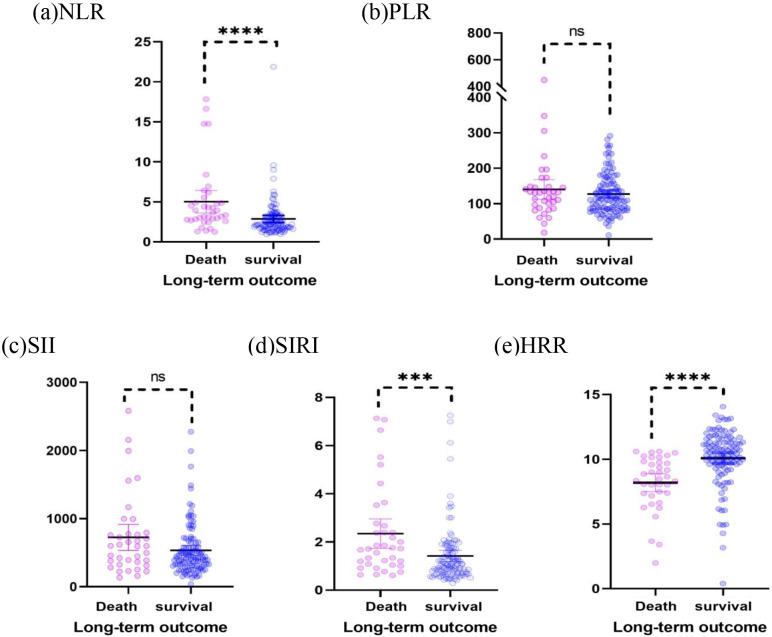
Fig. 1.
Scatter plots of the NLR, PLR, SII, SIRI, and HRR show the distribution in the survival group (n = 110) and mortality group (n = 37). (a) The NLR of the death group was higher than that of the survival group (p 0.000). (b) The PLR of the mortality group was similar to that of the survival group (p = 0.444). (c) The SII of the mortality group was similar to that of the survival group (p = 0.072). (d) The SIRI of the mortality group was higher than that of the survival group (p = 0.001). (e) The HRR of the mortality group was higher than that of the survival group (p 0.000). NLR, neutrophil-to-lymphocyte ratio; PLR, platelet-to-lymphocyte ratio; SII, systemic immune-inflammation index; SIRI, systemic inflammation response index; HRR, hemoglobin-to-red cell distribution width. *** indicates the p-value is less than 0.001; **** indicates the p-value is less than 0.000; ns indicates not statistically significant.

