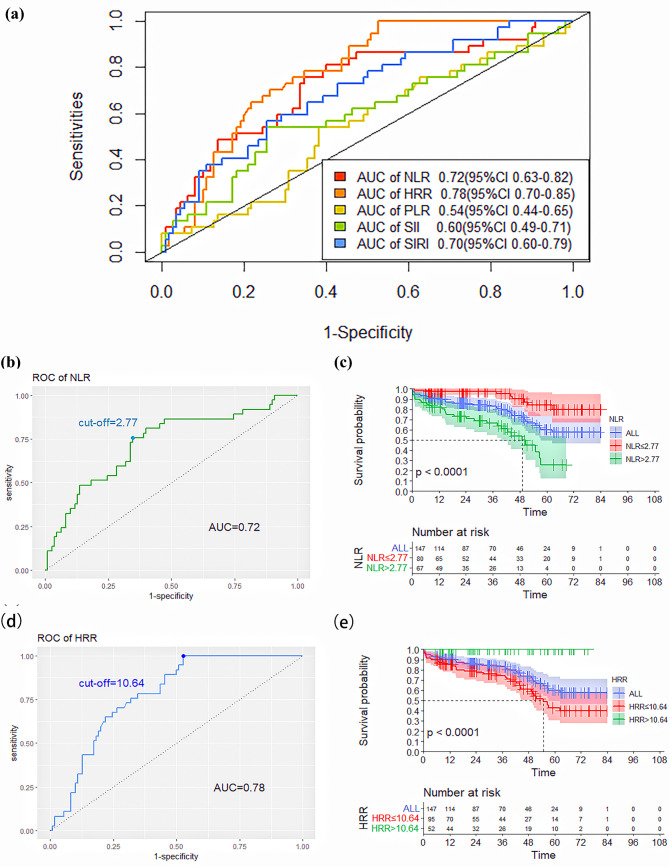
Fig. 2.
ROC curves of the NLR, PLR, SII, SIRI, and HRR for predicting death. (a) ROC curves of the NLR, PLR, SII, SIRI, and HRR for predicting mortality. (b) ROC curves and the cut-off value of the NLR for predicting mortality. (c) Kaplan–Meier survival curves of the lower-NLR and higher-NLR groups (p 0.0001). (d) ROC curves and the cut-off value of the HRR for predicting mortality. (e) Kaplan–Meier survival curves of the lower-NLR and higher-NLR groups (p 0.0001). ROC, receiver operating characteristic curve; AUC, the area under the receiver operating characteristic curve.

