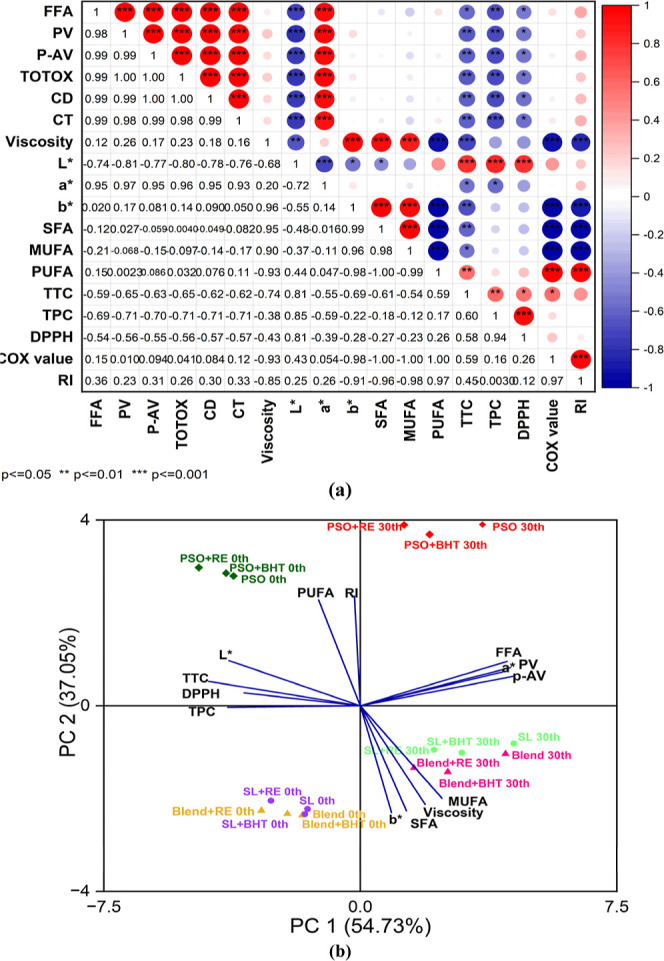
Figure 5.

(a) Heatmap Pearson’s correlation of the different parameters of oil samples. Significant difference at p < 0.05, p < 0.01, and p < 0.001. The Red color indicates positive correlation, and the blue color indicates negative correlation, as well as the number on the lower triangular side shows the Pearson correlation coefficient. (b) Biplot of the principal component analysis (PCA) for various oil parameters in oil samples on 0th and 30th day.
